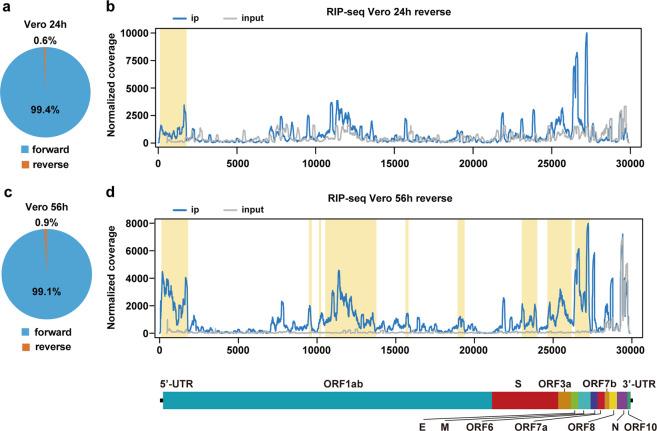
Fig. 3. Topology of m6A methylome in negative-sense RNA of SARS-CoV-2.
a The ratio of positive-sense and negative-sense RNA of SARS-CoV-2 harvested from Vero cells at 24 hpi. b Map of m6A peaks identified in the negative-sense RNA of SARS-CoV-2 isolated from SARS-CoV-2-infected Vero cells at 24 hpi by RIP-seq. Read coverage is normalized to the total number of reads mapping to the viral negative-sense RNA for each experiment. The distribution of m6A reads mapped to the SARS-CoV-2 negative-sense RNA is shown as blue line and the baseline signal from the RNA-seq signal of input samples is shown as a gray line. m6A peaks are shown as yellow rectangles along the x-axis. c The proportion of positive-sense and negative-sense RNA of SARS-CoV-2-infected Vero cells at 56 hpi. d m6A reads mapped to the SARS-CoV-2 negative-sense RNA extracted from SARS-CoV-2-infected Vero cells at 56 hpi. Data are representative of n = 2 determinations. The blue line shows the distribution of m6A reads mapped to the SARS-CoV-2 negative-sense RNA and the gray line shows the baseline signal of input samples. m6A peaks are shown as yellow rectangles along the x-axis.

