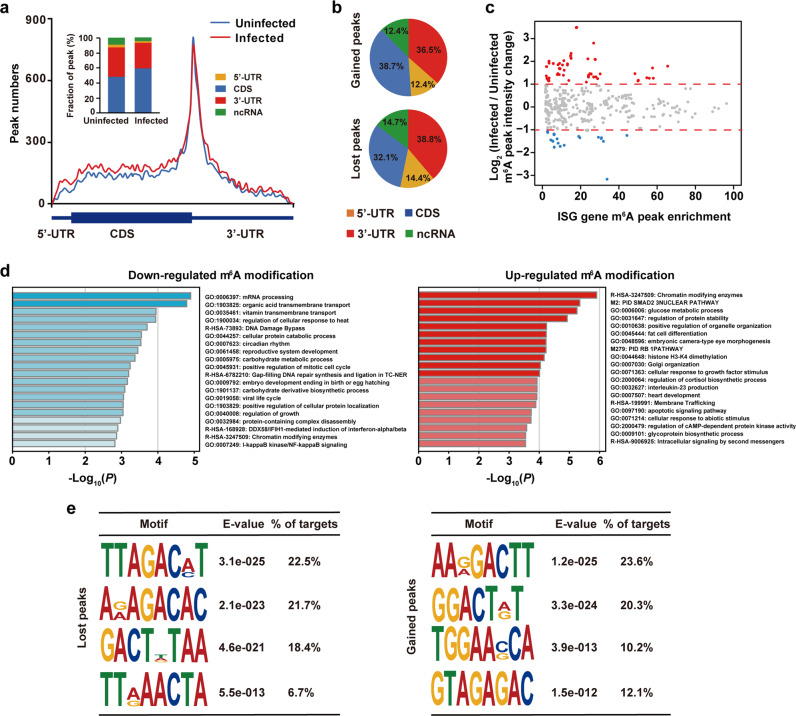
Fig. 5. SARS-CoV-2 infection influences m6A methylome of Huh7 cell transcripts.
a Distribution of the enriched m6A peaks in uninfected (blue line) and SARS-CoV-2-infected Huh7 cells (red line) analyzed along the RNA segments. Each segment was normalized according to its average length in Refseq annotation. Barplot shows the percentage of m6A peaks in the indicated regions. b Charts showing the distribution of gained (top) and lost m6A peaks (bottom) in the 5′ UTR (orange), CDS (blue), 3′ UTR (red) and ncRNA (green) of host cell RNA transcripts. Huh7 cells were uninfected or SARS-CoV-2 infected, and m6A peaks in total cellular RNA were analyzed at 120 h after infection. Representative of n = 2 determinations. c MA plot showing changes in m6A peak intensity of interferon-stimulated genes before and after SARS-CoV-2 infection. Upon SARS-CoV-2 infection, interferon-stimulated genes with no obvious changes in m6A peak intensity, higher m6A peak intensity and lower m6A peak intensity are represented by gray dots, red dots and blue dots, respectively. d GO enrichment analyses of genes with downregulated m6A peaks (left) and upregulated m6A peaks (right). e Motif analysis to identify consensus sequences for lost m6A peaks (left) and gained m6A peaks (right). The top four motifs for each are shown.

