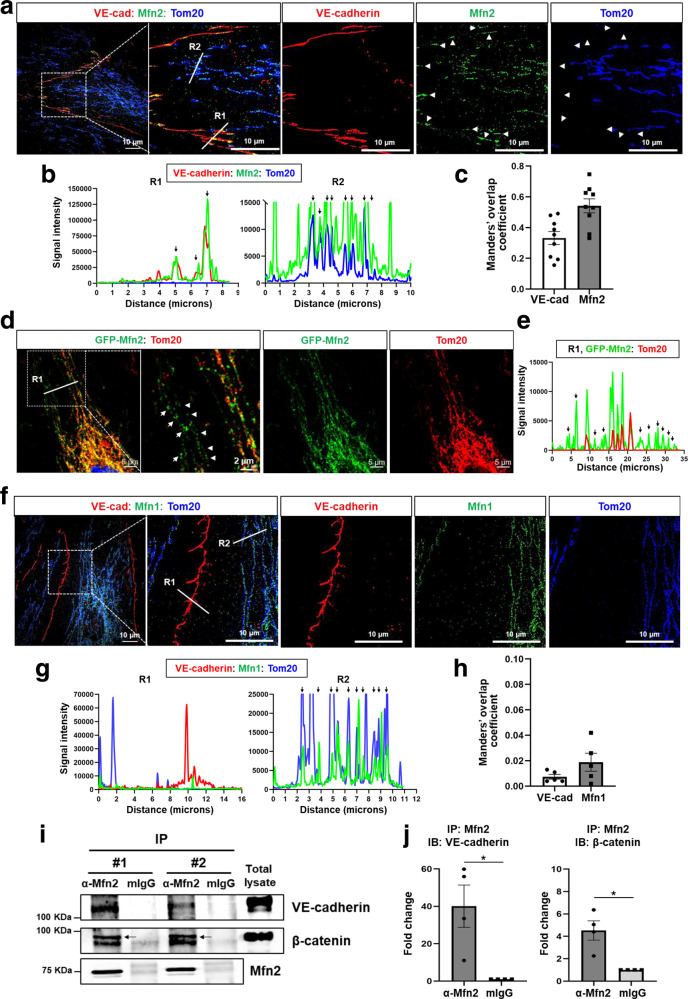
Fig. 1. Non-canonical localization of Mfn2 at the plasma membrane in endothelial cells.
Confluent HLMVECs were fixed with 4% PFA for 10 min and permeabilized with 0.25% Triton X-100 for 10 min. a Mfn2 cellular localization was examined by Mfn2 immunostaining with co-staining of the mitochondrial membrane protein Tom20 and the AJ protein VE-cadherin. The images were taken using three-dimensional illumination microscopy (SIM, DeltaVision OMX, Olympus 60X/1.42 NA Plan Apo objective). Images represent maximum intensity projection of 15–17 Z-planes (125 nm step size) acquired in full frame (1024 × 1024 pixel) structured illumination mode. Mfn2, Tom20, and VE-cadherin were pseudocolored with green, blue, and red, respectively. The white arrow heads represent non-mitochondrial Mfn2 at the AJs along the plasma membrane. b Co-localization of VE-cadherin, Mfn2, and Tom20 was analyzed by comparing the fluorescence intensity for each protein. The white lines, R1 and R2 of (a), indicate the area where the distance between Mfn2 and VE-cadherin, or Mfn2 and Tom20 was analyzed using ImageJ, respectively. The black arrow heads represent their co-localized regions. c The co-localization of Mfn2 and VE-cadherin was statistically estimated by Manders’ overlap coefficient analysis. The images are representative of n = 9 biologically independent samples. Data are mean values ± SEM. p = 0.0048 by paired, two-tailed t-test. d HLMVECs expressing GFP-Mfn2 were used to determine localization of Mfn2 and Tom2 by immunostaining with a specific antibody for Tom20 using confocal microscopy (Zeiss LSM880, Plan 1.46NA, ×63 magnification). Green color indicates GFP-Mfn2 and red color indicates Tom20. The white arrow heads represent non-mitochondrial Mfn2 in the cytosol. e Co-localization analysis of GFP-Mfn2 and Tom20 at R1 of (d) using ImageJ. The black arrows represent non-mitochondrial Mfn2. The images are representative of at least 3 independent experiments. f Mfn1 cellular localization was examined by Mfn1 immunostaining with co-staining of Tom20 and VE-cadherin using 3-D SIM. Images represent maximum intensity projection of 15–17 Z-planes (125 nm step size) acquired in full frame (1024 ×1024 pixel) structured illumination mode. Mfn1, Tom20, and VE-cadherin were pseudocolored with green, blue, and red, respectively. g Co-localization analysis of VE-cadherin and Mfn1 at R1 and R2 of (f) using ImageJ. R1 and R2 was used for analyzing co-localization of Mfn1 and VE-cadherin or of Mfn1 and Tom20, respectively, and black arrows represent their co-localized regions. h The co-localization of Mfn1 and VE-cadherin was statistically estimated by Manders’ overlap coefficient analysis. The images are representative of n = 5 biologically independent samples. Non-significance (ns), p = 0.1577 by unpaired, two-tailed t-test. i Confluent resting HLMVECs were used to determine interaction of Mfn2 and AJ proteins, VE-cadherin and β-catenin. Mfn2 were immunoprecipitated with a specific antibody followed by Western blotting with VE-cadherin or β-catenin antibodies. #1 and 2 indicate two independent experiments. Uncropped blots can be found in the Source Data file. j Quantification of band intensities in (I) using Image J. Data are mean values ± SEM for n = 4 independent experiments. *p = 0.0407 for VE-cadherin, *p = 0.0261 for β-catenin by paired, two-tailed t-test.

