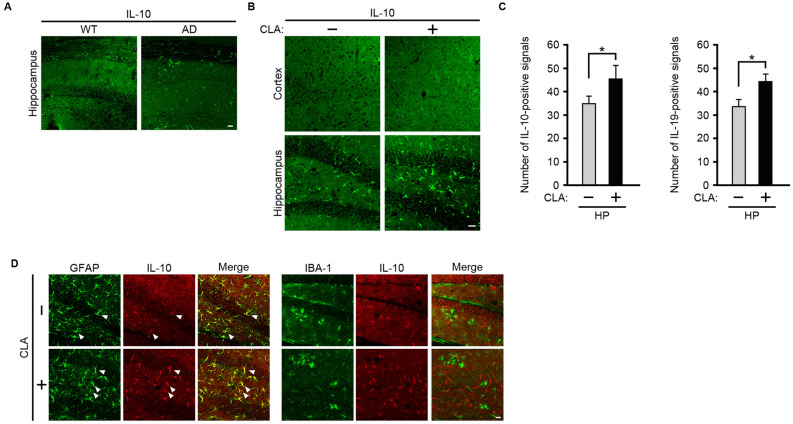
Figure 5.
The c-9, t-11-CLA diet upregulates the number of IL-10- or IL-19-expressing astrocytes in the hippocampus of AD model mice. (A) Immunostaining of brain sections of wild-type and AD model mice with anti-IL-10 antibody. (B) Immunostaining of c-9, t-11-CLA diet-fed and control diet-fed AD model mice with anti-IL-10 antibody. IL-10 (green)-positive cells were significantly increased in the hippocampus of c-9, t-11-CLA diet-fed AD model mice compared with controls (lower panels). IL-10 (green)-positive cells were not observed in the cortex (upper panels). (C) The histogram shows the number of IL-10-positive cells (left panel) and IL-19-positive cells (right panel) in the hippocampus. (n = 6 mice for each group; three different fields per mouse were used to count the number). *P < 0.05 (IL-10, P = 0.023; IL-19, P = 0.04). HP: hippocampus (D) Double immunostaining of brain sections in the hippocampus of c-9, t-11-CLA diet-fed and control diet-fed AD model mice with anti-GFAP (astrocyte marker), anti-IBA-1 (microglia marker), and anti-IL-10 antibodies. A portion of GFAP (green)-positive cells were IL-10 (red) positive as shown by yellow color (left merge panels), but IBA-1 (green)-positive cells were not co-localized with IL-10 (red)-positive cells (right merge panels). The arrows indicate the representative GFAP (green)- and IL-10 (red)-positive cells as shown by yellow color (right merged panels). Bar, 20 µm. WT: wild-type mice, AD: AD model mice. CLA + : c-9, t-11-CLA diet-fed AD mouse model, CLA − : control diet-fed AD model mice.

