
Figure 6.
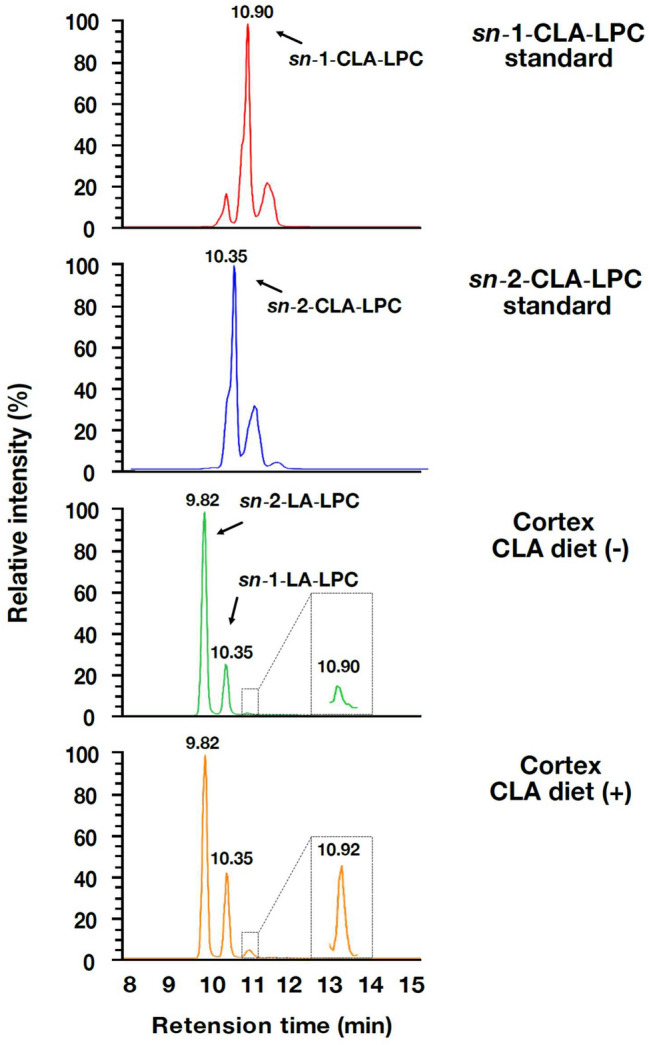
LC–MS/MS analysis of synthetic sn-1- and sn-2-CLA-LPC. Synthetic sn-1-CLA-LPC (top panel), synthetic sn-2-CLA-LPC (second panel from the top), the LPC peak area of the cortex lysate from control diet-fed mice (third panel from the top), and the LPC peak area of the cerebellum lysate from CLA diet-fed mice (bottom panel) were detected with LC–MS/MS analysis. Synthetic sn-1-CLA-LPC corresponded to the extra peak with a delayed retention time following the two peaks of LA-LPC (sn-1-LA and sn-2-LA. See27) observed in the cortex, whereas the peak of sn-2-CLA-LPC corresponded to that of sn-1-LA-LPC.