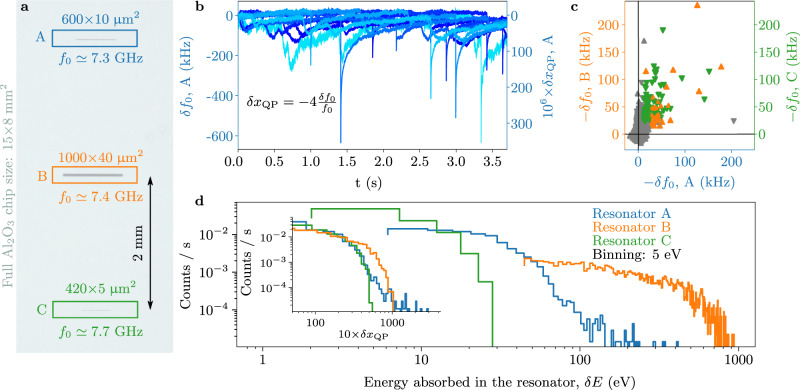
Fig. 1. Quasiparticle bursts and deposited energy in grAl resonators.
a False-colored photograph of the central part of the sapphire chip, supporting three 20 nm thick grAl resonators, labeled A, B, and C. b Overlay of ten measured time traces for the resonant frequency shift δf0 of resonator A. Similarly to refs. 10,21,36, quasiparticle (QP) bursts appear as sudden drops, given by the sharp rise in kinetic inductance, followed by a relaxation tail. The y-axis on the right-hand side shows the corresponding fractional quasiparticle density shift δxQP = −4δf0/f0. We identify a QP burst by applying a derivative filter, triggering only on sharp rises in the baseline. For clarity, the shown traces are selected to contain a QP burst; on average, only one trace in ten contains a QP burst. To highlight the fact that QP bursts are correlated in time, in c, we plot the measured frequency shifts of resonator B (upward triangles) and C (downward triangles) versus the frequency shift of resonator A. Colored markers correspond to values above threshold, with the threshold defined as two standard deviations of the baseline fluctuations (cf. Supplementary Information). Therefore, each colored marker depicts a time-correlated QP burst between resonators A–B (orange) and A–C (green). d Estimated distribution of the energy absorbed in the resonators δE = δxQPΔgrAlnCPV, calculated from the measured δxQP shown in the inset, where ΔgrAl ≃ 300 μeV is the grAl superconducting gap, and nCP = 4 × 106 μm−3 is the volume density of Cooper pairs, and V is the volume of each resonator. For each burst, the energy deposited in the substrate is estimated to be 103–104 times greater than δE (cf. Supplementary Information). The total QP burst rate ΓB is obtained by counting all bursts above the common threshold δxQP = 5 × 10⁻⁵.

