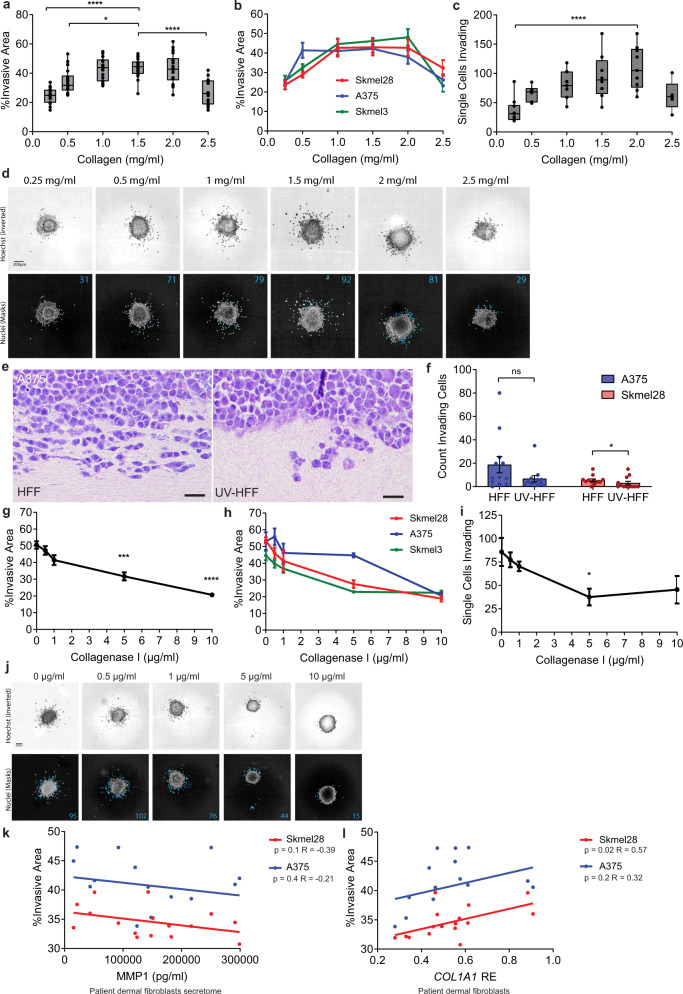
Fig. 2. Low collagen quantity and integrity decrease melanoma cell invasion.
a Mean and individual b melanoma spheroid invasion (Kruskal–Wallis with Dunn’s multiple comparison tests *p = 0.0317, ****p < 0.0001, n = 8 replicate spheroids for three cell lines across two-independent experiments), and c single cell invasion (Skmel28) (Kruskal–Wallis with Dunn’s multiple comparison tests ****p < 0.0001, n = 9 independent measurements over two experiments) in different collagen concentrations. d Representative images of spheroid and melanoma single cell invasion, top: Hoechst (inverted), bottom: invading cells (blue). e A375 melanoma invasion H&E (scale bar: 10 µm) and f single cell invasion in organotypic dermal collagen HFF and UV-HFF constructs (two-sided Mann–Whitney U *p = 0.0485, ns not significant, data represents 12 fields of view across two-independent experiments). g Mean and individual h melanoma invasion (Kruskal–Wallis with Dunn’s multiple comparison tests ***p < 0.001, ****p < 0.0001, n = 8 replicate spheroids for three cell lines across two-independent experiments), and i melanoma single cell invasion (Kruskal–Wallis with Dunn’s multiple comparison tests *p = 0.0426, n = 7 independent measurements over two experiments) by collagenase I concentration. j Representative images of spheroid and single cell invasion, top: Hoechst (inverted), bottom: invading cells (blue). k Melanoma spheroid invasion by adult patient fibroblast secretome, MMP1 levels (two-sided Pearson correlation, red: Sk-mel-28 R = −0.39 p = 0.1, blue: A375 R = −0.21 p = 0.4, data represent eight independent cell lines measured in duplicate) and l by COL1A1 relative expression (RE) in fibroblasts (two-sided Pearson correlation, red: Sk-mel-28 R = 0.57 p = 0.02, blue: A375 R = 0.32 p = 0.2, data represent eight independent cell lines measured in duplicate). Error bars: standard error of the mean (bar).

