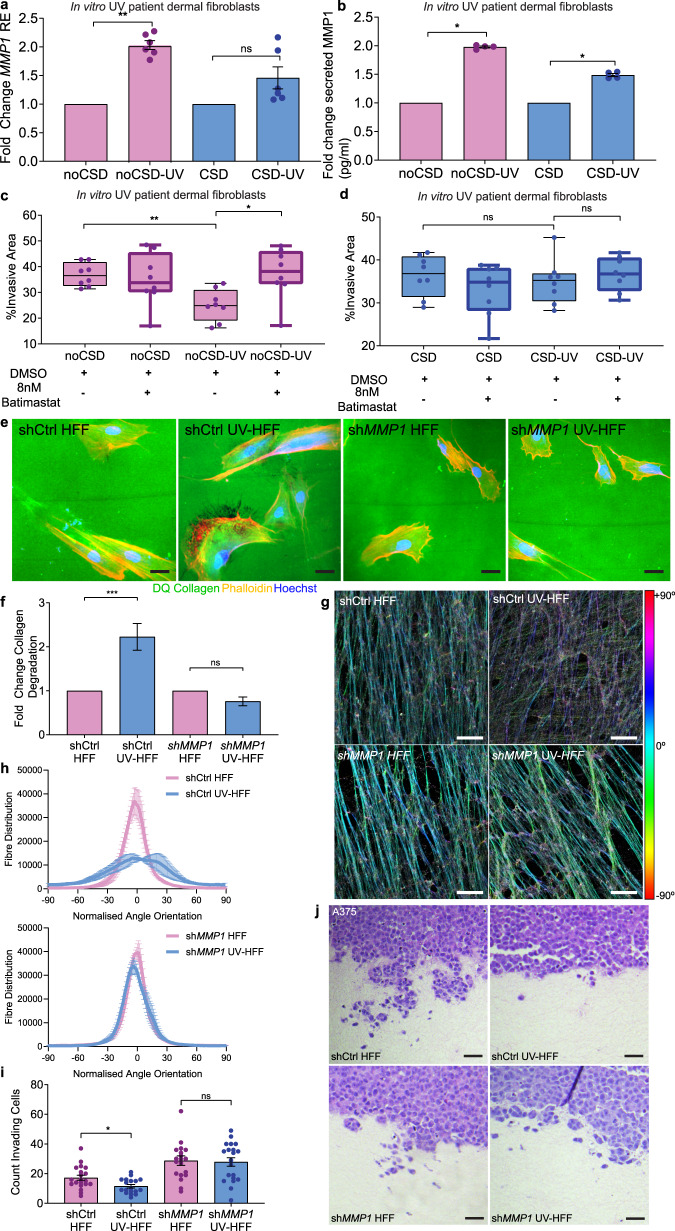
Fig. 3. Inhibition of MMP1 restores melanoma invasion.
a Fold change in MMP1 relative expression (RE) in chronically UVR-treated adult patient fibroblasts compared to untreated isogenic cell lines, noCSD no chronic sun damage, pink, CSD chronic sun damage, blue (two-sided Mann–Whitney U **p = 0.0022, ns not significant, data represent two samples per condition quantified in triplicate). b Fold change in secreted MMP1 in chronically UV-treated adult fibroblasts compared to untreated isogenic cell lines, noCSD no chronic sun damage, pink, CSD chronic sun damage, blue, (two-sided Mann–Whitney U *p = 0.0286, data represent two samples per condition quantified in triplicate). c Melanoma spheroid invasion in noCSD and isogenic noCSD-UV fibroblast secretomes in the presence of Batimastat or DMSO vehicle, (two-sided Mann–Whitney U **p = 0.0011, *p = 0.0104, data represents eight replicate spheroids measured across two-independent experiments per condition). d Melanoma spheroid invasion in CSD and isogenic CSD-UV fibroblast secretomes in the presence of 8 nM Batimastat or DMSO vehicle, (two-sided Mann–Whitney U, ns not significant). Data represents eight replicate spheroids measured across two-independent experiments per condition, box plots represent 25th to 75th percentiles with median, whiskers represent minimum and maximum values. e Representative images of collagen degradation in shCtrl-HFF, shCtrl-UV-HFF, shMMP1-HFF and shMMP1-UV-HFF fibroblasts. Green: intact DQ collagen; red: phalloidin; blue: Hoechst. Size bars: 20 µm. f Fold change in collagen degradation of shCtrl-HFF and shMMP1-HFF (pink), and their isogenic chronic UVR cell lines shCtrl-UV-HFF and shMMP1-UV-HFF (blue), (two-sided Mann–Whitney U ***p = 0.0007, ns not significant, n = 149 scores across two biologically independent cell lines per condition). g Immunofluorescence of fibronectin fibres in decellularised shCtrl-HFF, shCtrl-UV-HFF, shMMP1-HFF and shMMP1-UV-HFF-derived ECM, colour coded for orientation of fibre, cyan represents mode, red ±90°, scale bar: 25 µm. h Quantification of fibre alignment distribution in shCtrl-HFF, shCtrl-UV-HFF, shMMP1-HFF and shMMP1-UV-HFF-derived ECM, data represents z-stacks of three fields of view per sample. i Quantification of invading melanoma cells into organotypic dermal collagen constructs made with shCtrl-HFF and shMMP1-HFF (pink), and isogenic chronic UVR cell lines shCtrl-UV-HFF and shMMP1-UV-HFF (blue), (two-sided Mann–Whitney U *p = 0.0272, ns not significant, data represents >8 fields of view for two-independent experiments in biologically independent cell lines), scoring was performed on duplicate constructs counting in at least five fields of view per cell line. j Representative images of A375 invasion into organotypic constructs stained with H&E (scale bar: 10 µm). Error bars represent standard error of the mean (bar).

