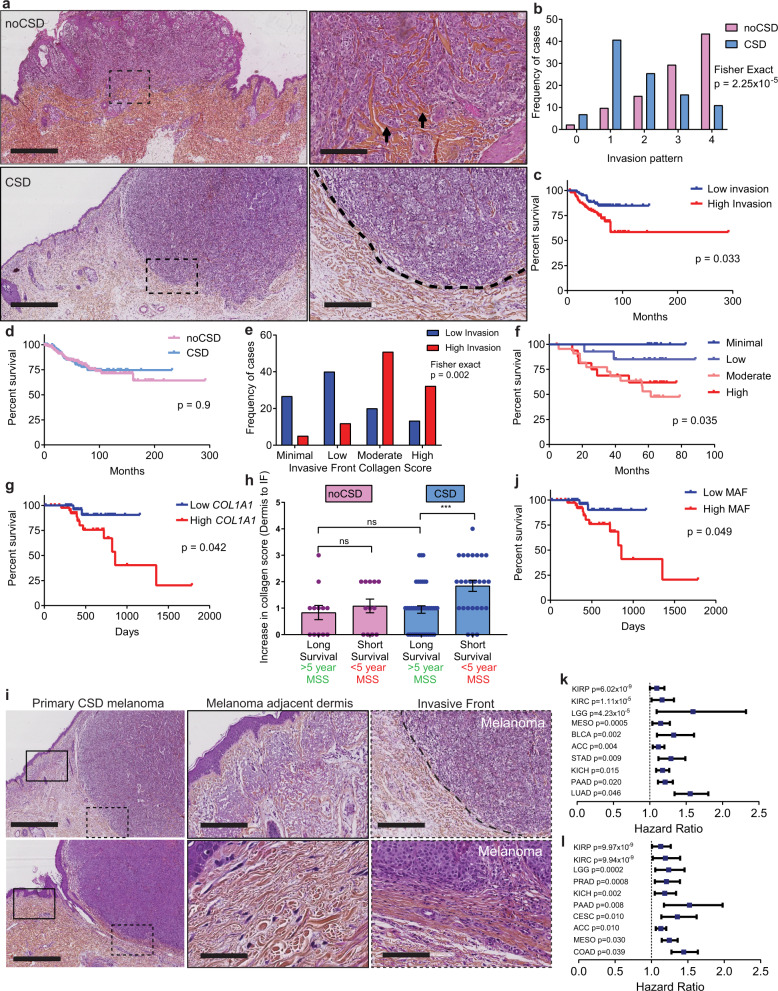
Fig. 4. Low collagen correlates with low invasion and improved outcome in aged melanoma patients.
a H&E top panel: primary cutaneous melanoma and inset (box) with single cell invasion (arrows) in a collagen-rich dermis with no chronic sun damage (noCSD), collagen: red (scale bars left: 4000 µm, right: 400 µm). Lower panel: melanoma in a collagen-poor dermis with chronic sun damage (CSD) and inset (box), no single cell invasion; collagen: red (scale bars left: 3000 µm, right: 300 µm). b Histogram displaying melanoma invasion at the invasive front (IF) in noCSD and CSD melanomas (B and C cohorts, n = 170, two-sided Fisher exact test, p = 2.25 × 10⁻⁵). c Kaplan–Meier of melanoma-specific survival (MSS) in prominent (high, red) and minimal (low, blue) melanoma invasion at the IF (two-sided log-rank test, B and C cohorts, n = 167). d Kaplan–Meier of MSS in melanoma invading in CSD (blue) and noCSD (pink) dermis (two-sided log-rank test, B and C cohorts, n = 331). e Histogram displaying collagen quantity at the IF in highly invasive (red) and minimally invasive (blue) melanoma (C cohort, n = 89, two-sided Fisher exact test, p = 0.002). f Kaplan–Meier of MSS by collagen quantity at the IF (two-sided log-rank test, C cohort, n = 62). g Kaplan–Meier of MSS by COL1A1 expression in aged (>54) primary cutaneous melanoma (two-sided log-rank test, TCGA cohort, n = 80). h Fold increase in collagen deposition at the IF of noCSD and CSD melanomas by MSS (two-sided Mann–Whitney U ***p = 0.0009 C cohort n = 90). Error bars represent standard error of the mean (bar). i H&E top panel: left CSD melanoma, middle: from box inset: tumour-adjacent dermis; right: from dashed box inset: IF (dashed line, scale bars: 2000, 300, 300 µm). Bottom: left CSD melanoma, middle: from box inset: tumour-adjacent dermis; right: from dashed line box inset: IF between dashed lines, arrows: melanoma invasion, (scale bars: 2000, 70, 200 µm, n = 90). j Kaplan–Meier of MSS by melanoma-associated fibroblast (MAF) signature score in aged (>54) primary cutaneous melanoma cohort (two-sided log-rank test, TCGA cohort, n = 80). k Hazard ratio (centre) and 95% CI (bars) for OS, and PFS (l) in two-sided univariate Cox regression of COL1A1 expression by cancer type in PANCAN TCGA, p values unadjusted. (ACC n = 79, adrenocortical carcinoma, BLCA n = 407, bladder urothelial carcinoma, CESC n = 304, cervical and endocervical cancers, COAD n = 448, colon adenocarcinoma, KICH n = 65, kidney chromophobe, KIRC n = 533, kidney renal clear cell carcinoma, KIRP n = 289, kidney renal papillary cell carcinoma, LGG n = 514, brain lower grade glioma, LUAD n = 506, lung adenocarcinoma, MESO n = 86, mesothelioma, PAAD n = 178, pancreatic adenocarcinoma PRAD n = 497, prostate adenocarcinoma, STAD n = 409, stomach adenocarcinoma). Risk tables for all Kaplan–Meier analyses in Supplementary Data 2.

