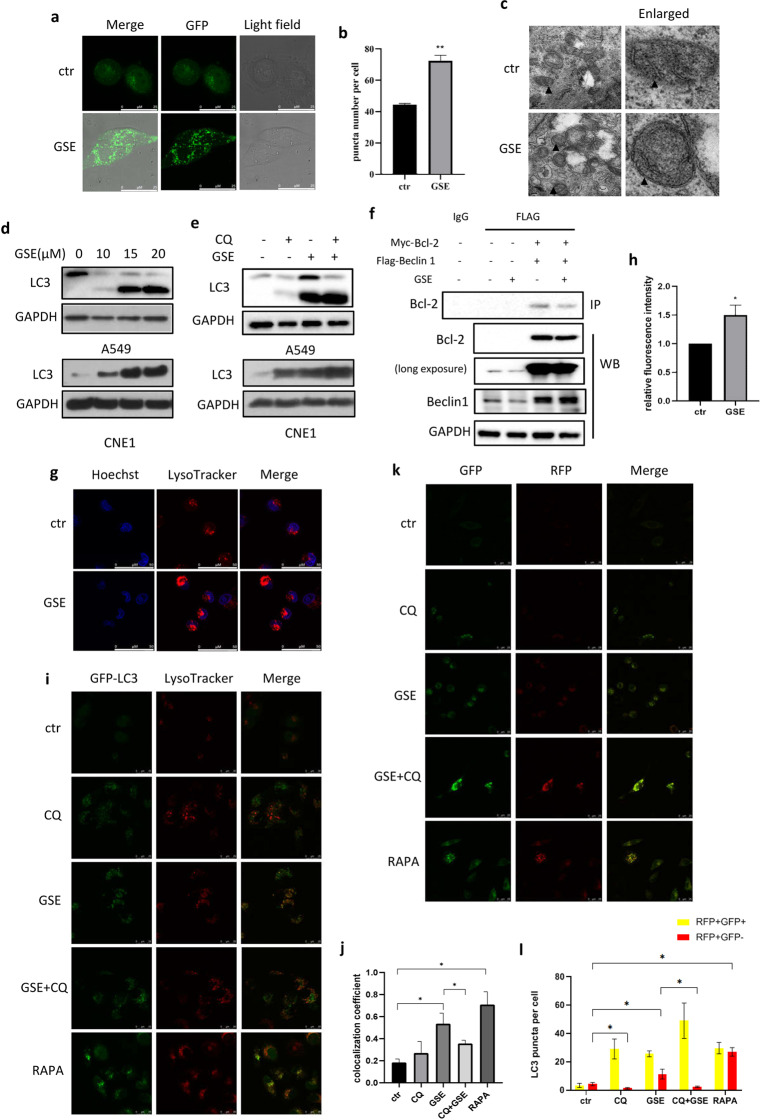
Fig. 2. GSE induced autophagy and promotes the fusion of autophagosomes and lysosomes.
a, b HeLa cells stably expressing GFP–LC3 were treated with GSE for 48 h. Confocal images of GFP–LC3 puncta are shown (scale bar: 25 µm). GFP puncta were quantified by ImageJ. **P < 0.01. c TEM images show the ultrastructure of A549 cells under GSE treatment (scale bar 0.2 μm). ▲ indicates double-membrane autophagosomes. d Expression of the LC3 protein in A549 and CNE1 cells under GSE treatment was determined. e Expression of the LC3 protein with or without CQ pretreatment in A549 and CNE1 cells under GSE treatment for 48 h was determined. f The interaction between Bcl-2 and Beclin 1 was determined using IP. GAPDH was used as a loading control. g, h LysoTracker staining was performed in GSE-treated A549 cells examined under confocal microscopy(scale bar: 50 µm), and cell fluorescence was measured by flow cytometry. *P < 0.05. i, j HeLa–GFP–LC3 cells were treated with GSE in the presence of the autophagy inhibitor CQ or the autophagy inducer rapamycin, and then stained with LysoTracker. The colocalization of lysosomes and GFP–LC3 was determined under a confocal microscope. The colocalization coefficient was detected using Image-Pro Plus. *P < 0.05. k, l L929 cells stably expressing fLC3B were treated with GSE with or without an autophagy inhibitor or inducer. Confocal images of GFP–LC3 and RFP–LC3 puncta are shown (scale bar: 25 µm). *P < 0.05.

