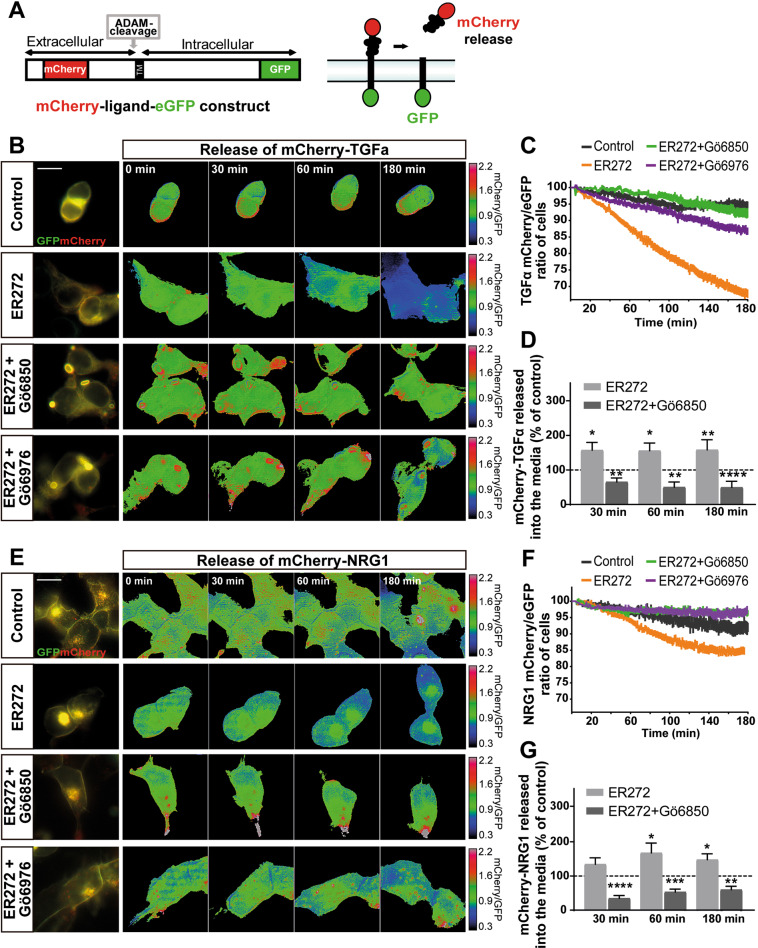
Fig. 5. ER272 induces of mCherry-TGFα-GFP ectodomain shedding.
A Scheme of mCherry-TGFα-GFP construct and action mechanism. B Images of mCherry-TGFα-GFP expressing, serum-starved HEK293T cells stimulated with diluent, ER272 (5 µM), ER272 plus the general PKC inhibitor Gö6850 (5 µM) and ER272 (5 µM) plus the classical inhibitor of PKC Gö6976 (1 µM) during 180 min. PKC inhibitors were added 30 min before ER272. mCherry/GFP ratio images at the indicated time points are shown in the intensity modulated display-mode. The color ranging goes from red to blue to represent mCherry/GFP ratios. The upper and lower limits of the ratio range are shown on the right. Scale bar represent 20 µm. C Quantitative analysis of the microscopic images obtained from the time-lapse assays of HEK293T cells expressing mCherry-TGFα-GFP. mCherry/GFP ratios were normalized to the average mCherry/GFP ratio measured before stimulation. The mean normalized mCherry/GFP ratios and SEM are shown, n = 40. See also supplementary movie 1 and 2. D Fluorescence analysis of m-Cherry signal in the culture medium of HEK293T cells transfected the mCherry-TGFα-eGFP construct. mCherry signal released to the culture media at different time points was measured in a fluorimeter using non-transfected cells as blank. 50 µL of medium (5% of the total volume) of control (transfected non-treated cells) and cells treated with ER272 and ER272 + Gö6850 were measured at different time points after the treatment. mCherry fluorescence was plotted as a ratio of the eGFP fluorescence measured in the cell fraction of control (dashed line) and treated cells (bars). Data are the mean values ± S.E.M of nine independent measurements (n = 9). Statistical analysis: two tailed unpaired Student’s t test (*ER272 vs. control at 30 min, p = 0.0191; **ER272 + Gö6850 vs. control at 30 min, p = 0.0049; *ER272 vs. control at 60 min, p = 0.0135; **ER272 + Gö6850 vs. control at 60 min, p = 0.0045; **ER272 vs. control at 180 min, p = 0.0024; ****ER272 + Gö6850 vs. control at 180 min, p < 0.0001). E Images of mCherry-NRG-GFP expressing, serum-starved HEK293T cells stimulated with diluent, ER272 (5 µM), ER272 plus the general PKC inhibitor Gö6850 (5 µM) and ER272 (5 µM) plus the classical inhibitor of PKC Gö6976 (1 µM) during 180 min. PKC inhibitors were added 30 min before ER272. mCherry/GFP ratio images at the indicated time points are shown in the intensity modulated display-mode. The color ranging goes from red to blue to represent mCherry/GFP ratios. The upper and lower limits of the ratio range are shown on the right. Scale bar represent 20 µm. F Quantitative analysis of the microscopic images obtained from the time-lapse assays of HEK293T cells expressing Cherry-NRG-GFP. mCherry/GFP ratios were normalized to the average mCherry/GFP ratio measured before stimulation. The mean normalized mCherry/GFP ratios and SEM are shown, n = 40. See also supplementary movie 3 and 4. G Fluorescence analysis of shedded mCherry-fused NRG. mCherry released to the culture media of transfected HEK293T cells was measured in a fluorimeter as described in the Material and Methods section. Cells were treated with ER272 and/or the general PKC inhibitor Gö6850 at the indicated times. Data are the mean values ± S.E.M of nine independent measurements (n = 9). Statistical analysis: two tailed unpaired Student’s t test (****ER272 + Gö6850 vs. control at 30 min, p < 0.0001; *ER272 vs. control at 60 min, p = 0.0389; ***ER272 + Gö6850 vs. control at 60 min, p < 0.0001; *ER272 vs. control at 180 min, p = 0.0172; **ER272 + Gö6850 vs. control at 180 min, p < 0.0018).

