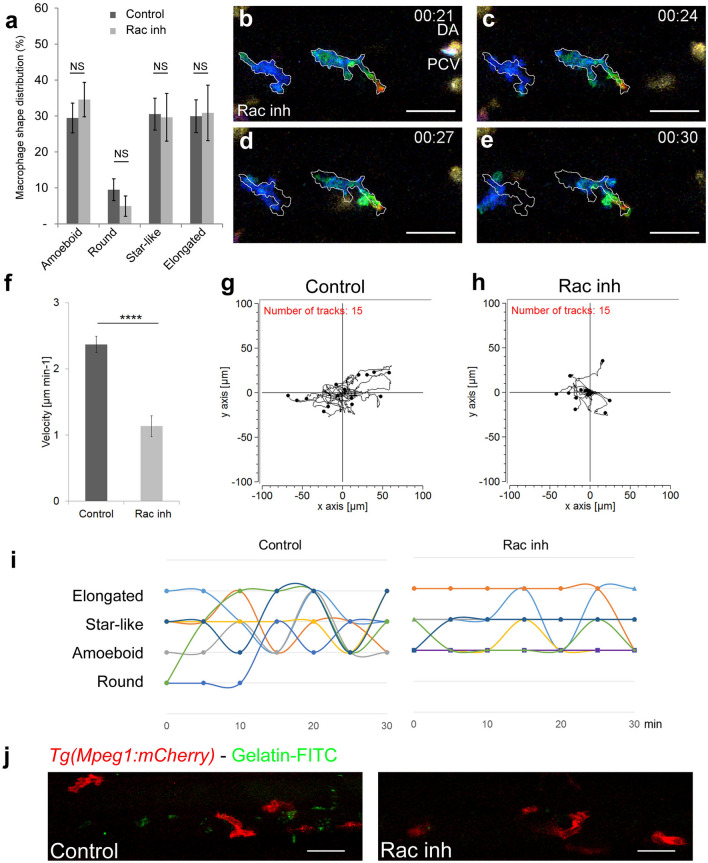
Figure 3.
Rac inhibition leads to a loss of macrophage plasticity and motility. (a) Graph comparing macrophage shape distribution in the AGM of NSC23766 Rac-inhibited embryos (Rac Inh) to DMSO treated embryos (control) shows no significant change of distribution. N = 10 embryos for control and 15 for Rac inh. Data are represented as the mean of the percentage of each shape type in the total macrophage population in the AGM ± s.e.m. NS = not significant. (b–e) Selected cropped images from Video 2 showing the shape and migration of macrophages over time of Rac inhibited embryo. Time code in hours and minutes. White outlines on panel (c–e) indicate the shape and position of macrophages from panel (b) (21st minute). (f) Graph showing the velocity of macrophages in control and Rac-inhibited embryos. Data are represented as a mean ± s.e.m., n = 15 macrophages from 4 different embryos, ****p < 0.0001. (g,h) Tracking plot diagram representing the migration path and distance of macrophages in the AGM in control and Rac-inhibited embryos measured every minute for 60 min. Scale in µm, n = 15 macrophages from 4 different embryos. (i) Graph shows the shape evolution of individual macrophages during a 30 min course with 5 min interval measurements, Control to the left, Rac inhibitor to the right. Each line represents a single macrophage (n = 7). Statistically significant differences exist in the number of shapes adopted during a 30 min measurement course (P = 0.003) as well as in the number of changes between two different shapes (P = 0.006). (j) In vivo zymography in Tg(Mpeg1:mCherry) embryos at 48 hpf reveals the degradation of inserted gelatin (green dots of cleavage-revealed FITC) in control embryos and a highly reduced degradation after Rac inhibition. See also Video 2. Scale bar 30 µm. See also Supplementary Figure S2.

