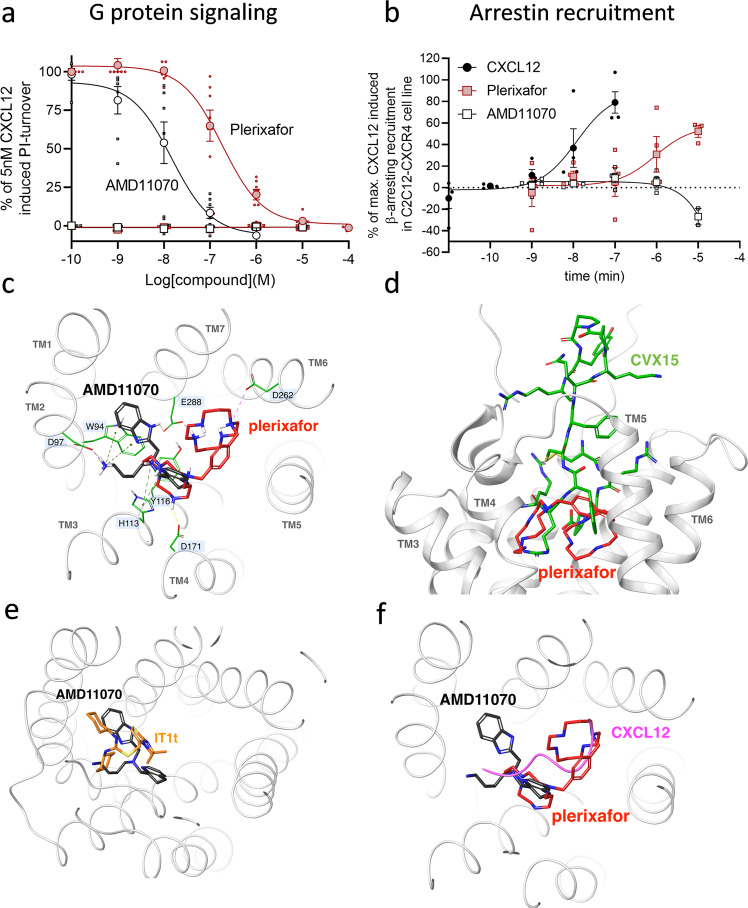
Fig. 3. Plerixafor and AMD11070 show distinct pharmacological profiles at CXCR4 and display different CXR4 binding modes.
a Agonism and antagonism of CXCR4 induced G protein activity. Measured by inositol triphosphate (IP3) accumulation in HEK293 cells transiently transfected with CXCR4 and the chimeric G protein Gqi4myr in the absence (square) or presence (circle) of 5 nM CXCL12 (corresponding to 80% activity). Cells were stimulated with increasing concentration of plerixafor (red) or AMD11070 (white). The data were normalized to signaling levels in response to 5 nM CXCL12 and presented with %mean ± SEM of duplicates from at least three independent experiments. b β-arrestin recruitment to CXCR4 by plerixafor (red square) and AMD11070 (white square). CXCL12 (black circle) was used as a control. β-arrestin2 recruitment was measured in C2C12 cells stably expressing Prolink (PK)-tagged CXCR4 and Enzyme Acceptor (EA)-tagged β-arrestin2. The data were normalized to the maximal recruitment levels by CXCL12 and presented with %mean ± SEM of duplicates from four independent experiments. c Overlay of the proposed binding modes for plerixafor (red) and AMD11070 (black) in the full-length CXCR4 model (extracellular view). CXCR4 transmembrane helices are shown and annotated in gray. Key binding residues are annotated on a light blue background and shown as sticks in green. Interactions: ionic = dotted magenta; H-bonds = dotted yellow; cation-pi = dotted green. d Overlay of the proposed binding mode for plerixafor (red) and the experimental binding mode for the peptide CXCR4 antagonist CVX15 (green; PDB 3OE0) (side view). e Overlay of the proposed binding mode for AMD11070 (black) and the experimental binding mode for the small-molecule CXCR4 antagonist IT1t (orange; PDB 3ODU) (viewed as in Fig. 3c). f The suggested path of the distal CXCL12 N-terminus (magenta) overlaid on plerixafor (red) and AMD11070 (black) (viewed as in Fig. 3c).

