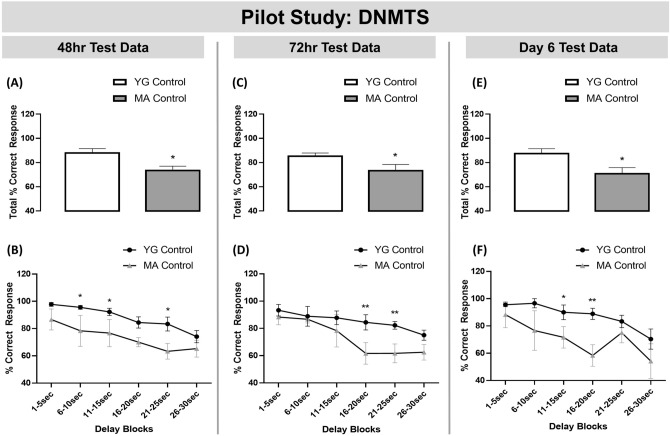
Figure 1.
MA rats were impaired in the DNMTS task compared to YG controls. MA animals were impaired in the DNMTS task compared to YG controls at: (A) 48 h test-point overall performance; (B) 48 h test-point at the 6–10 s, 11–15 s to 21–25 s delay time bins; (C) 72 h test-point overall performance; (D) 72 h test-point at the 16–20 s and 21–25 s delay time bins; (E) Day 6 test-point overall performance; and (F) Day 6 test-point at the 11–15 s and 16–20 s delay time bins. Histograms represent Total % Correct response (the mean group performance across all delay lengths in the DNMTS task ± SEM), n = 4–6 per group. DNMTS trials were sorted by performance according to length of delay on individual trials and were grouped according to 5-s intervals (1–5, 6–10, 11–15, 16–20, 21–25, and 26–30) represented by line graphs (mean ± SEM). Two-way ANOVA followed by Fishers LSD analysis **p < 0.01, *p < 0.05 vs. YG controls.

