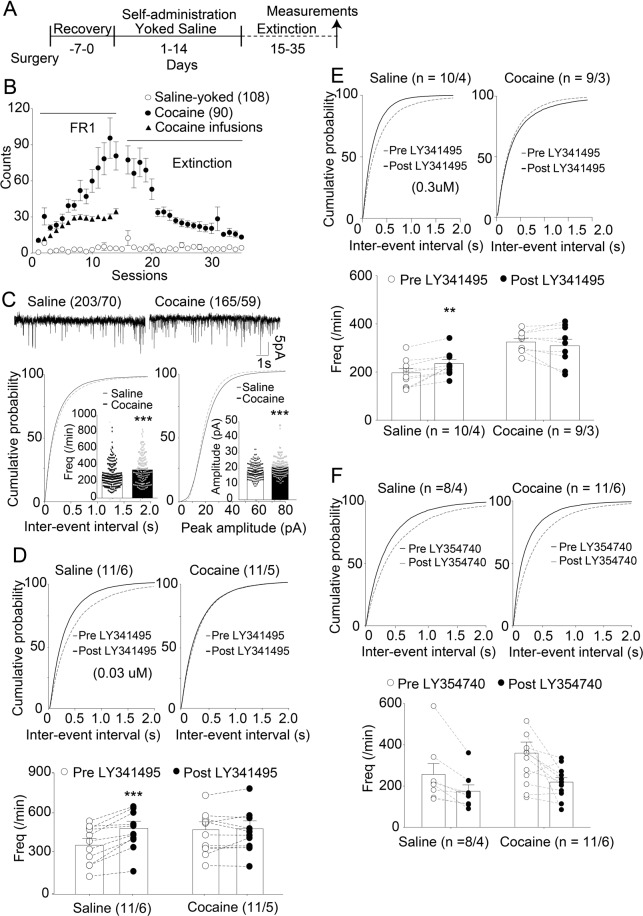
Fig. 1. Decreased mGluR2/3-mediated feedback inhibition at NAcore glutamatergic synapses after cocaine self-administration and extinction training.
A Training procedure of cocaine self-administration and saline control. Recovery on the left-hand side denotes the number of days of recovery provided after catheter implantation. All measurements in all figures were performed after two weeks of extinction training and consisted of patch-clamp recordings from medium spiny neurons (MSNs) in NAc slices. B Active lever pressings and infusions of all cocaine and saline groups used in all data. C Upper: Representative traces of sEPSC. Lower: Cumulative distributions of inter-event intervals (left) or event amplitudes (right). Inset, mean event frequencies (left) or amplitudes (right). sEPSC frequency and amplitude in cocaine group were significantly higher than those in the saline group (***p < 0.001, unpaired t test). This convention is used in all other figures as well. Upper: Cumulative distributions of inter-event intervals pre- and post-LY341495 (or LY354740). Lower: The event frequencies from individual neurons. Synaptic glutamate release probability was less sensitive to LY341495 (0.03 μM & 0.3 μM) in the cocaine group (D, E). LY354740 (0.2 μM) had a significant impact on sEPSC frequency regardless of training condition (F). **p < 0.01, ***p < 0.001 comparing cocaine with saline group using two-way ANOVA with repeated measures followed by a Bonferroni’s post hoc test. The first and second N numbers in parentheses correspond to the numbers of recorded neurons and rats, respectively. Dots in B presented the mean values ± SEMs. Each dot in C–F represents an individual cell. Data with the lines connecting indicate within-subjects designs.

