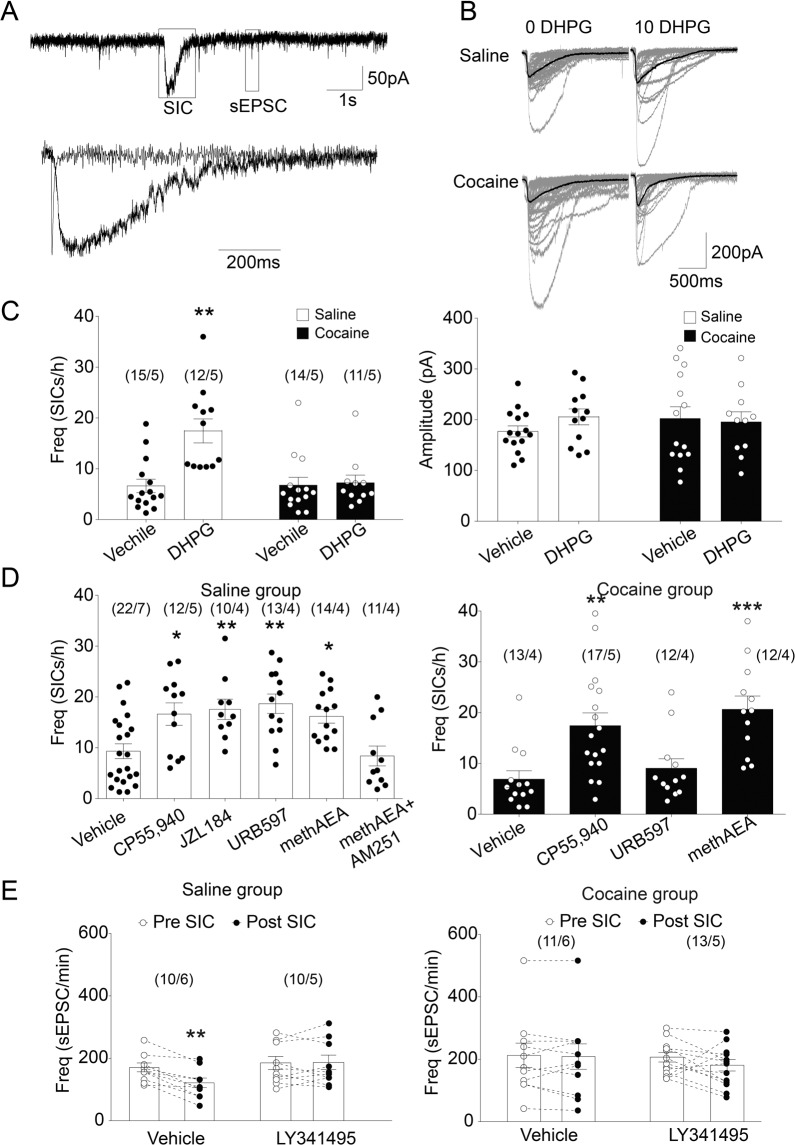
Fig. 4. The effects of mGluR5 and CB1 activation on astrocytic glutamate release in the NAcore of the saline group or cocaine group.
A Upper: Recordings from a medium spiny neuron showing SICs and sEPSCs. Lower: Overlay of scaled sEPSC and SICs shown in the upper lane to compare their kinetics. B Sample traces of SICs from saline and cocaine groups with or without DHPG (10 μM) perfusion. C The mGluR5 agonist, DHPG, remarkably increased SICs frequency in the saline group but not in the cocaine group. DHPG did not change the peak amplitude of SICs in the two groups. ** p < 0.01 compared to vehicle-treated neurons using one-way ANOVA with repeated measures followed by a Bonferroni’s post hoc test. D CB1R agonist CP55,940 (0.3 μM) or methAEA (30 μM) increased SICs frequency in both saline and cocaine groups. CB1R antagonist AM251 (10 μM) blocked the effect of methAEA on SICs frequency. However, AEA hydrolase inhibitor URB597 (1 μM) increased SICs frequency in the saline group but not in the cocaine group. E In the absence of LY341495, sEPSC frequency before the SIC is significantly higher than sEPSC frequency after SIC in saline group, but not in cocaine group. *p < 0.05, **p < 0.01 compared to vehicle-treated neurons using one-way or two-way ANOVA followed by a Bonferroni’s post hoc test. Data are represented as the mean values ± SEMs. N numbers shown in parentheses correspond to the number of recorded neurons and the number of recorded rats per group, respectively. SIC: slow inward current. Data with the lines connecting indicates within-subjects designs. Data without the lines connecting indicates between-subjects designs.

