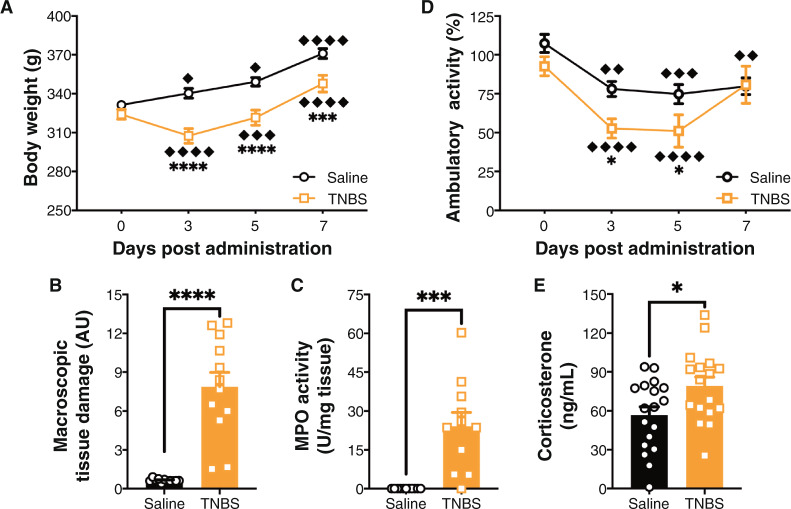
Fig. 1. TNBS-induced colitis phenotype.
A There was a significant interaction on body weight between time post-administration and trinitrobenzene sulfonic acid (TNBS) administration, and a main effect of both time and colitis. Saline animals gained weight each day. TNBS animals initially lost weight, but gained after Day 3. There were no differences at baseline between conditions, but there were at Days 3, 5, and 7. n = 12/group. ♦ p < 0.05, ♦♦♦ p < 0.001, ♦♦♦♦♦ p < 0.0001 compared to previously recorded weight in same condition. ***p < 0.001, ****p < 0.0001 saline vs. TNBS on the same day. B TNBS administration at Day 7 post-administration led to a significant increase in macroscopic tissue damage. n = 12/group. ****p < 0.0001 t test saline vs. TNBS. C TNBS administration at Day 7 post-administration led to a significant increase in myeloperoxidase activity (MPO). Each 1 Unit (U) of MPO activity was the amount of enzyme required to split 1µmol H2O2 per min at 25 °C. n = 12/group. ***p < 0.001 t test saline vs. TNBS. D There were no differences in locomotor activity between saline and TNBS groups at baseline, but there was a reduction in ambulatory activity at Day 3 and Day 5, but not at Day 7. Saline and TNBS administered animals both showed reductions in ambulatory activities compared to their baselines. n = 4–6/group. ♦♦ p < 0.01, ♦♦♦ p < 0.001, ♦♦♦♦ p < 0.0001 compared to Day 0 in same condition. *p < 0.05 saline vs. TNBS on the same day. E TNBS led to a significant increase in plasma corticosterone levels. n = 17–18/group at Day 7 post-administration. *p < 0.05 t test saline vs. TNBS. Saline = left, black bars with circles. TNBS = right, orange bars with squares.

