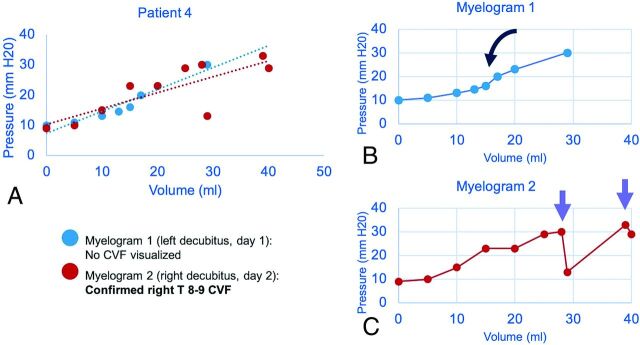
FIG 1.
Sample craniospinal compliance curves in a 51-year-old man confirmed to have CVF at operation. Combined plot of 2 CTMs with dashed lines showing a linear approximation of compliance (A). Initial nondiagnostic CTM (B) shows a roughly sigmoid pattern with an inflection point seen after a ∼15-mL normal saline bolus was administered (black curved arrow). Repeat CTM with more aggressive positive-pressure augmentation shows an abrupt loss of pressure (purple arrows) after infusion volume of 27 mL of normal saline (C). The CVF became apparent only after pressure was increased beyond this threshold point.

