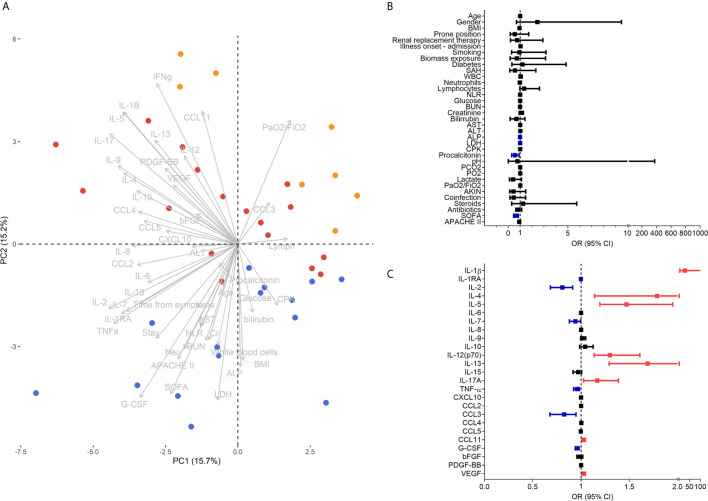
Figure 4.
Clinical and immunological factors that distinguish pandemic influenza A(H1N1) and severe COVID-19. (A) Principal component analysis (PCA) of the clinical and immunological characteristics of study participants. Each dot represents a single individual, and each color represents a group of participants: blue for pandemic influenza A(H1N1), orange for moderate COVID-19, and red for severe COVID-19. (B, C) Bivariate logistic regression analysis of the clinical and immunological characteristics associated with the causative pathogen in the two cohorts of patients with severe influenza and COVID-19. The forest plots show the odds ratio (OR) and 95% CI interval values that were non-significant (black) and significant for severe COVID-19 (red). OR values of factors inversely associated with severe COVID-19 that instead predict pandemic influenza A(H1N1) are shown in blue color. Absolute OR values are also presented in Supplementary Table 3 .

