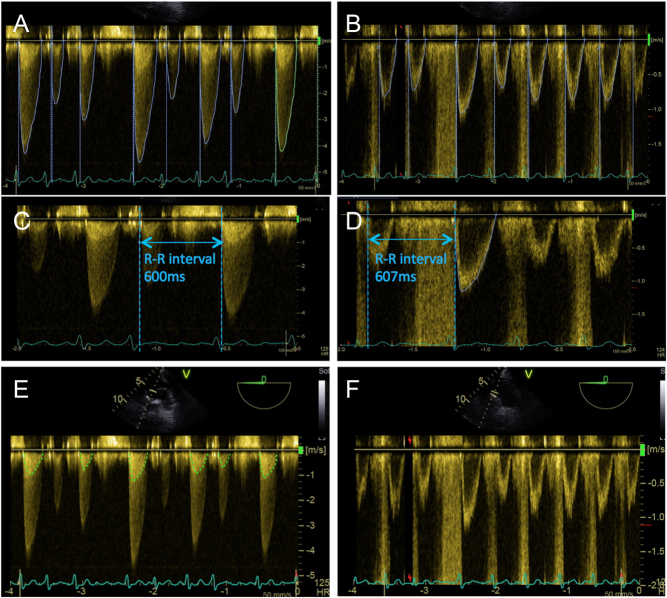
Figure 13.
Assessment of Doppler indices and AVA in AF. Doppler traces obtained from a patient in AF (A and B): note marked beat-to-beat variations of the CW and PW waveforms. Conventionally, at least 5–10 consecutive CW and PW traces are obtained for assessment of valve indices (A and B). An alternative method is the ‘matched R–R interval’ approach: in image (C) the R–R interval is seen as 600 ms, and the CW waveform is traced. In image (D) a comparable PW waveform is found, whereby the R–R interval is noted to be 607 ms, and is therefore traced. The obtained values from these comparable CW and PW traces can be used in the continuity equation. Within CW traces it is possible to appreciate a ‘phantom’ LVOT trace (E). The true LVOT trace is displayed in image (F) for comparison. This phantom trace should not be used for the continuity equation, as it will directly lead to an underestimation of AS severity.

 This work is licensed under a