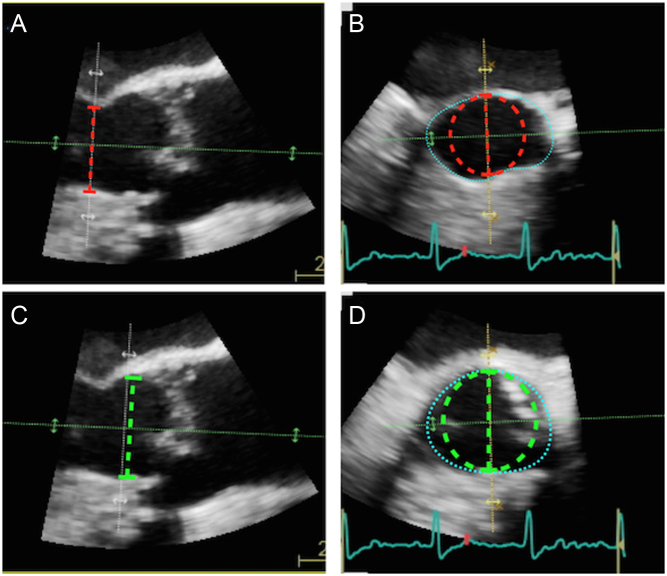
Figure 9.
Error arising from the assumption of circular LVOT. Image (A) depicts a long-axis view of the aortic valve obtained using 3D TOE. The LVOT diameter has been measured 2 cm proximal to the valve (red dotted line). Image (B) is a short axis image obtained at this anatomical level. Estimation of the LVOT cross-sectional area at this point calculates the area of the red dotted circle, and is a huge underestimate of the ‘true’ LVOT area (marked by blue dotted outline). The LVOT should be measured immediately below the insertion of the aortic cusps (c; green dotted line). Image (D) depicts the short axis view at this anatomical level: note the LVOT demonstrates a much more circular profile. Estimation of the LVOT area using π(LVOTd ÷ 2)2 would calculate the area of the green dotted circle, which is much closer to the ‘true’ LVOT area (blue dotted line). On occasion, direct planimetry of the LVOT cross-sectional area using 3D echo can be considered, particularly for difficult cases (see low-gradient AS, ‘Special circumstances’ section).

 This work is licensed under a