Figure 3.

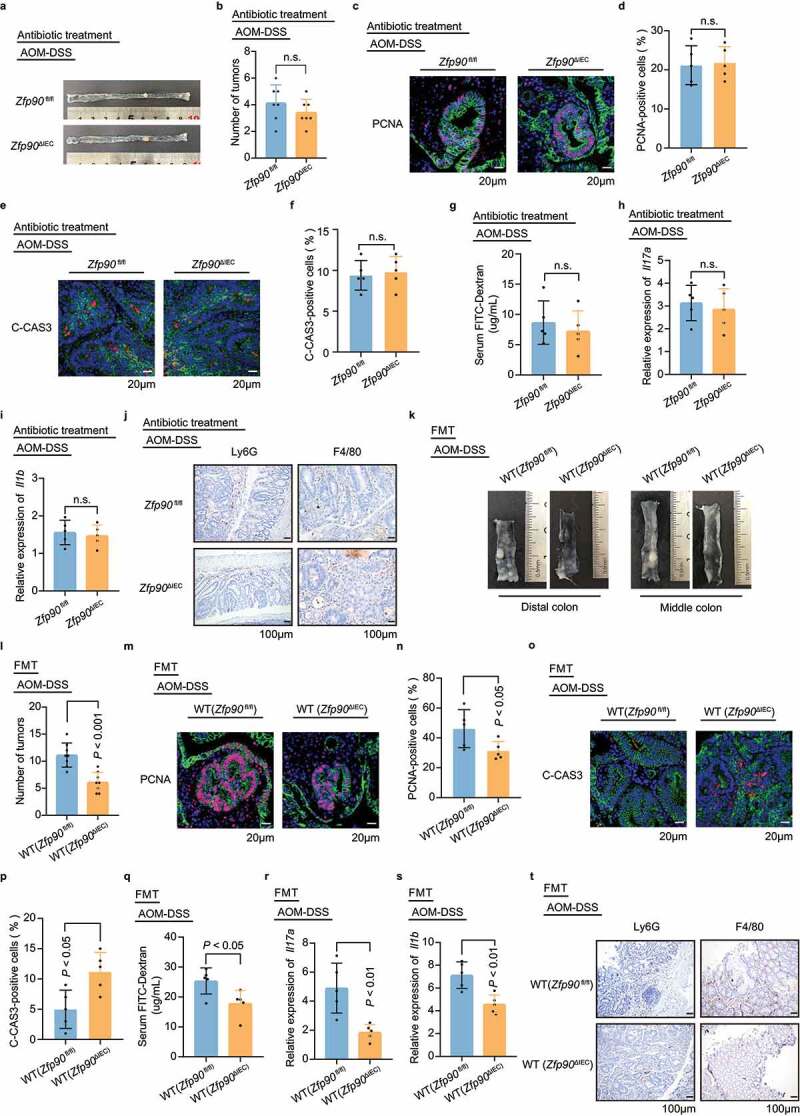
The gut microbiota is indispensable for the antitumor phenotype in Zfp90ΔIEC mice. a Representative images of colons in antibiotic-treated Zfp90fl/fl and Zfp90ΔIEC mice after AOM-DSS treatment. b Tumor numbers in antibiotic-treated Zfp90fl/fl and Zfp90ΔIEC mice (n = 7 per group). c Representative immunofluorescence staining of the PCNA protein in tumor tissues from antibiotic-treated Zfp90fl/fl and Zfp90ΔIEC mice after AOM-DSS treatment. Sections were stained with DAPI (blue), CDH1 (green) and PCNA (red). d The percentage of PCNA-positive tumor cells was quantified (n = 5 per group). e Representative immunofluorescence staining of C-CAS3 protein in tumor tissues from antibiotic-treated Zfp90fl/fl and Zfp90ΔIEC mice after AOM-DSS treatment. Sections were stained with DAPI (blue), CDH1 (green) and C-CAS3 (red). f The percentage of C-CAS3-positive tumor cells was quantified (n = 5 per group). g Intestinal permeability assessed by FITC-dextran in antibiotic-treated Zfp90fl/fl and Zfp90ΔIEC mice (n = 5 per group). h, i Real-time PCR was performed to determine the mRNA expression of Il17a and Il1b in the colonic epithelium from antibiotic-treated Zfp90fl/fl and Zfp90ΔIEC mice (n = 5 per group). j Representative immunohistochemical staining for LY6G and F4/80 in colon segments from antibiotic-treated Zfp90fl/fl and Zfp90ΔIEC mice with AOM-DSS treatment. k-t Gavage of WT mice with feces from Zfp90fl/fl and Zfp90ΔIEC mice (n = 5–8 per group). Representative images of distal and middle colons (k), number of tumors (l), representative immunofluorescence staining of PCNA (m), percentage of PCNA-positive tumor cells (n), representative immunofluorescence staining of C-CAS3 (o), percentage of C-CAS3-positive tumor cells (p), the serum FITC-Dextran level (q), mRNA expression of Il17a and Il1b in the colonic epithelium (r, s), and representative immunohistochemical staining for LY6G and F4/80 (t) from WT (Zfp90fl/fl mice) and WT (Zfp90ΔIEC mice) under AOM-DSS treatment. Sections were stained with DAPI (blue), CDH1 (green) and PCNA or C-CAS3 (red). Data with error bars represent the mean ± SD. Each panel is a representative experiment of at least three independent biological replicates. Nonpaired two-tailed t-test (b, d, f, g, h, i, l, n, p, r, s) and the Mann–Whitney U test (q) were used
