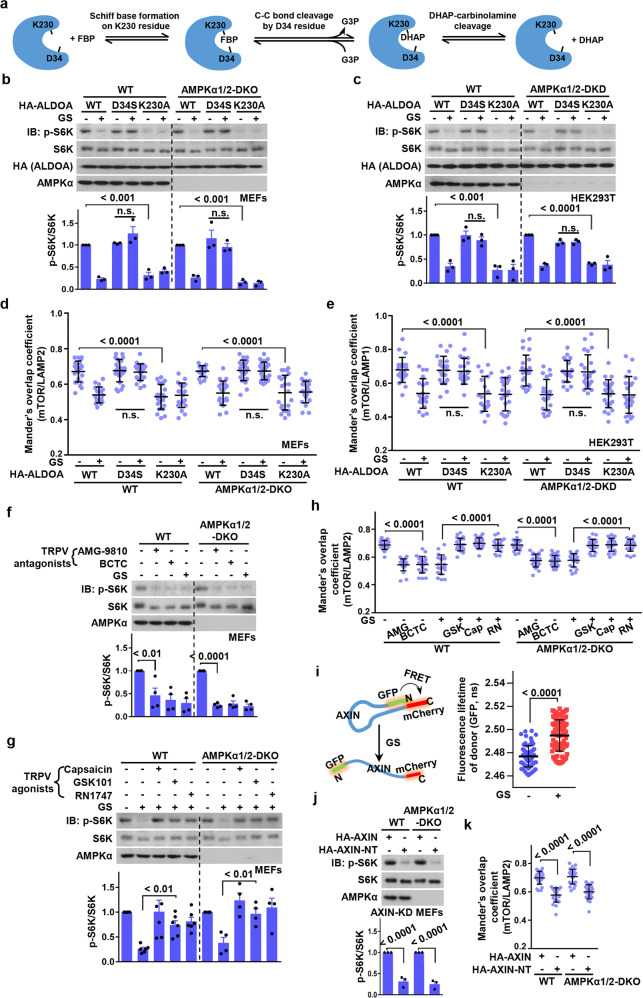
Fig. 1. Aldolase is a sensor of glucose availability for mTORC1 regulation.
a Schematic diagram of catalytic mechanisms of aldolase.8 b–e Expression of the D34S aldolase mutant retains mTORC1 activity in low glucose, while the K230A mutant inhibits mTORC1 even in high glucose. Wild-type and AMPKα1/2-DKO MEFs (b, d), and wild-type and AMPKα1/2-DKD HEK293T cells (c, e) were infected with lentivirus expressing HA-tagged ALDOA, the D34S or K230A mutants; the cells were then incubated in DMEM medium with 8 mM glucose, or were starved for glucose (GS) for 2 h. mTORC1 activity was assessed by determining of p-S6K and S6K levels by immunoblotting, followed by densitometry analysis (b, c, data are means ± SEM, n = 3, with P values calculated by ANOVA). The lysosomal localization of mTOR (d, e) was determined by immunofluorescent staining. mTOR, and the lysosomal marker LAMP2 (d) or LAMP1 (e) were stained, and Mander’s overlap coefficients were plotted as means ± SD, n = 19–24, with P values calculated by ANOVA (see representative images in Supplementary information, Fig. S2a, b). f–h Inhibition of TRPV impairs mTORC1 activity in high glucose, and activation of TRPV restores the mTORC1 activity in low glucose. Wild-type and AMPKα-DKO MEFs were treated with 5 μM AMG-9810 (AMG) or 10 μM BCTC for 30 min in DMEM medium containing 8 mM glucose (f, h), or glucose-starved for 2 h, followed by addition of 50 nM GSK101 (GSK), 100 nM capsaicin (Cap), or 0.7 μM RN1747 (RN) for 15 min (g, h). Levels of p-S6K and S6K were then determined by immunoblotting, followed by densitometry analysis (f, g, data are means ± SEM, n = 4–6; P values were calculated by ANOVA). The localization of mTOR (h) was determined by immunofluorescent staining as in (d), and Mander’s overlap coefficients were plotted as means ± SD, n = 20–26, with P values calculated by ANOVA (See representative images in Supplementary information, Fig. S3a). i The conformation of AXIN, determined by FRET–FLIM, changes in response to low glucose. MEFs were infected with lentivirus expressing AXIN1 tagged at the N-terminus with GFP (FRET donor) and at the C-terminus with mCherry (FRET acceptor). The resultant AXIN1 construct was named the M2M4 mutant, which carries mutations in the DIX domain to prevent intermolecular interactions,15 so that the FRET signals only reflect intramolecular interactions. Cells were incubated in DMEM medium with 8 mM glucose, or starved for glucose (GS) for 2 h, and the fluorescent lifetimes of GFP were measured and plotted as means ± SD; n = 70 and 105 for cells incubated in 8 mM and 0 mM glucose, respectively. P values were calculated by Student’s t-test. j, k Expression of AXIN-NT inhibits mTORC1 activity in high glucose. Wild-type and AMPKα-DKO MEFs with AXIN knockdown were infected with lentiviruses expressing HA-tagged AXIN and AXIN-NT. Cells were incubated in DMEM medium with 8 mM glucose. Levels of p-S6K and S6K were then determined by immunoblotting, followed by densitometry analysis (j, data are means ± SEM, n = 3; P values were calculated by Student’s t-test). The localization of mTOR (k) was determined by immunofluorescent staining as in (d), and Mander’s overlap coefficients were plotted as means ± SD, n = 22–26 with P values by ANOVA (see representative images in Supplementary information, Fig. 3b). All experiments in this figure were performed at least twice.

