Figure 1.

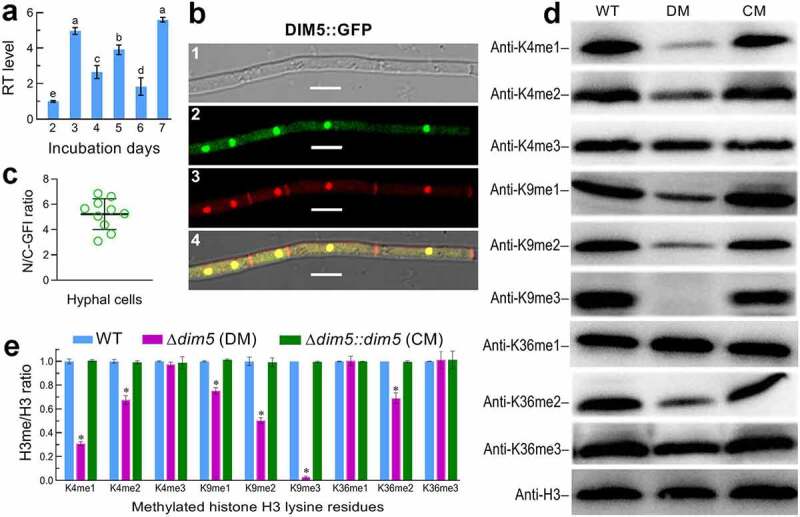
Transcript profile, subcellular localization and catalytic activity of DIM5 in B. bassiana. (a) Relative transcript (RT) levels of dim5 in the SDAY cultures of a wild-type strain (WT) during a 7-day incubation at an optimal regime of 25°C and L:D 12:12 with respect to the standard at the end of a 2-day incubation. (b) Microscopic images (scales: 5 μm) for subcellular localization of GFP-tagged DIM5 fusion protein (DIM5:GFP) expressed in WT. Hyphae were collected from a 3-day-old SDBY culture stained with a nuclear dye (shown in red). Panels 1, 2, 3 and 4 denote bright, expressed (green), stained and merged views of the same field. (c) Ratios of nuclear versus cytoplasmic green fluorescence intensities (N/C-GFI) of the fusion protein assessed from the cells of 10 hyphae. (d) Western blots for mono-, di and tri-methylated signals of H3K4, H3K9 and H3K36 in the nuclear protein extracts isolated from the 3-day-old SDBY cultures of the WT, Δdim5 (DM) and Δdim5::dim5 (CM) strains. Aliquots of 40 μg protein extracts were probed with appropriate antibodies (detailed in Table S3). (e) Ratios of methylated lysines versus nuclear H3 signal intensities (H3me/H3 ratio) quantified from the blots of three proteins samples per strain. Significant differences from Tukey’s HSD tests are marked with different lowercase letters (P< 0.05 in (a) or asterisk (P< 0.001 in (e)). Error bars: SDs of the means from three independent replicates
