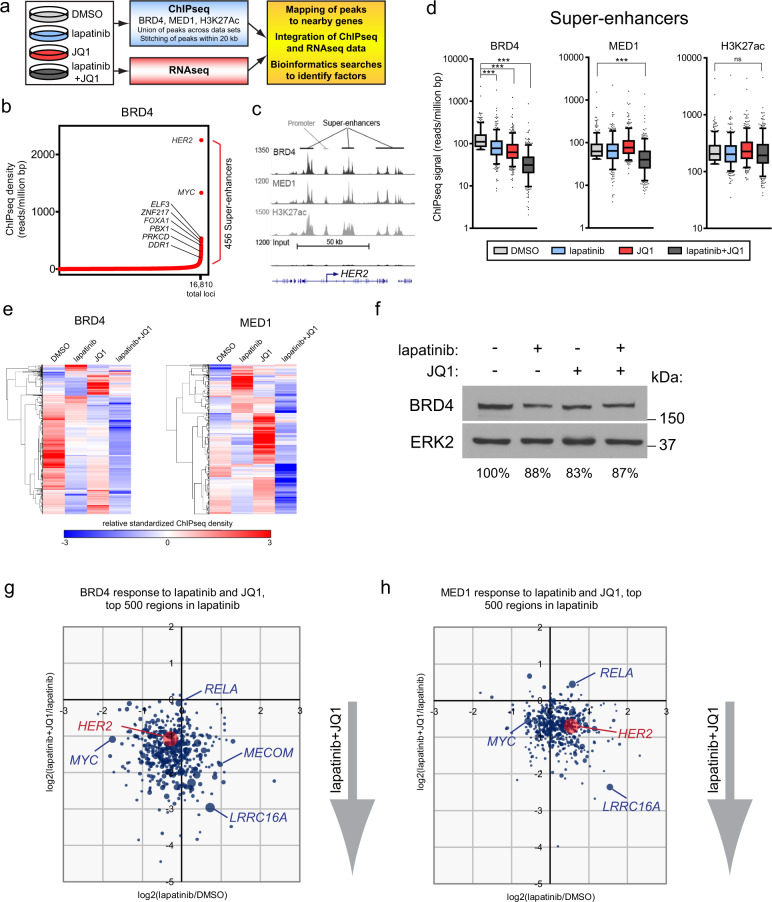
Fig. 1. Combined inhibition of HER2 and BET bromodomains induces broad epigenetic dysregulation.
a Experimental strategy to identify epigenetic and transcriptional adaptive responses to HER2 inhibition in cell line models using 300 nM lapatinib and 300 nM JQ1 for 24 h, alone or in combination. b ChIPseq analysis of the HER2+ breast cancer cell line, SKBR-3, was performed to identify BRD4 binding sites. Super-enhancers (456 regions) were identified as regions above the inflection point of increasing BRD4 ChIPseq density. c Multiple SEs identified by high density of BRD4, MED1, and H3K27Ac are found flanking the HER2 locus. d BRD4 and MED1 binding to SE domains is significantly reduced by the combination of lapatinib and JQ1, but H3K27Ac is unaffected. Box plots: median, upper/lower quartile, and 5–95 percentile. Unpaired t-test, ***= P < 0.0001. e Unsupervised hierarchical clustering of all genomic loci bound by BRD4 and MED1. Lapatinib and JQ1 each increase BRD4 and MED1 binding to discrete regions but the combination of drugs results in a loss of binding at the majority of loci. f Total protein levels of BRD4 are largely unaffected by lapatinib and JQ1 as determined by immunoblotting of treated SKBR-3 cells. ERK2 was used as a loading control. g, h The combination of lapatinib and JQ1 cooperatively reduce BRD4 and MED1 binding to HER2 and MYC. The top 500 regions of highest ChIPseq density in response to lapatinib are shown for g BRD4 and h MED1. The log2 fold change in density in response to lapatinib vs. DMSO is plotted on the x-axis. The log2 fold change of lapatatinib + JQ1 vs. lapatinib alone is plotted on the y-axis. Dot size is relative to ChIP density in lapatinib.

