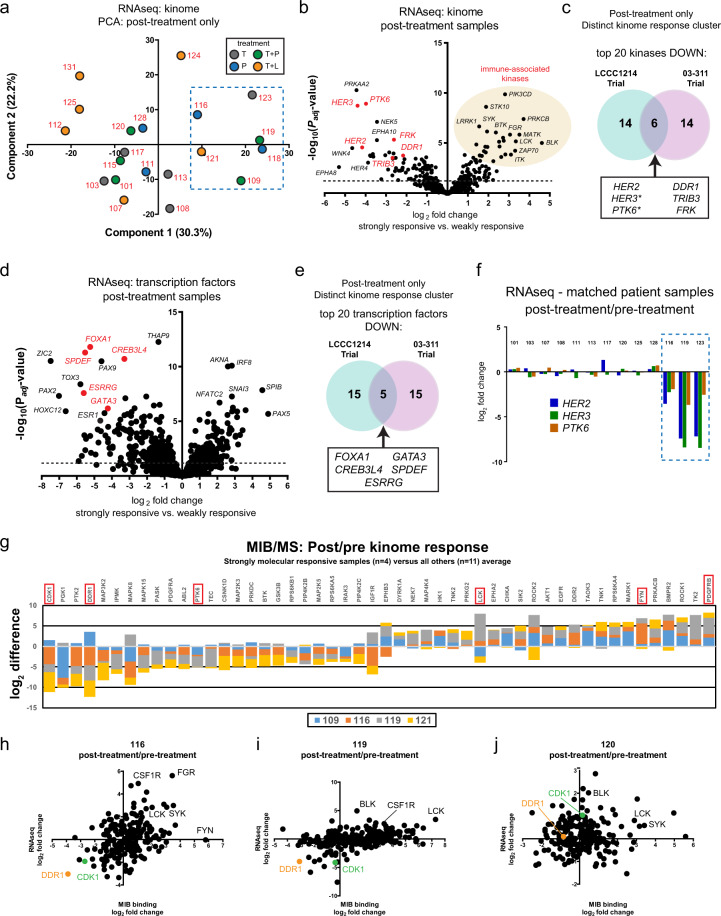
Fig. 5. Distinctly responsive post-treatment samples share common kinome and transcriptome features following HER2 targeting.
a All post-treatment samples with RNAseq data were used to filter for expressed kinases. The normalized kinome expression data was used for principal component analysis (PCA). Patient number is indicated in red for each dot and color indicates LCCC1214 treatment arm. Dashed line indicates previously identified patients 116, 119, and 123 and neighboring samples 109, 118, and 121. b RNAseq expression levels of strongly responsive post-treatment samples were compared to the less-responsive post-treatment samples by DESeq2 to identify differentially expressed kinases. The volcano plot indicates the magnitude and the significance of the identified expression differences. Dashed line indicates FDR 5%. c Log2 normalized gene expression data (GSE76360) of the kinome was analyzed from the 03-311 clinical trial (Clinical trials identifier NCT00148668), in which patient samples were obtained pre-treatment and after 10–14 days of trastuzumab. Post-treatment gene expression data of the kinome was used for unsupervised hierarchical clustering and a segregated cluster of 7 post-treatment patient samples (of 50 total) was identified. Marker selection was performed in Morpheus (Broad Institute) to identify the top 20 kinases significantly down in the strongly responsive post-treatment samples for 03-311 trial data and from DESeq2 analysis of the LCCC1214 trial from (b). Venn diagram shows the 6 kinases common to both data sets. Asterisks indicate that more than one gene probe was identified by marker selection for the 03-311 data set (Illumina expression beadchip). d DESeq2 analysis of differentially expressed transcription factors in the strongly responsive versus weakly responsive post-treatment LCCC1214 samples. The volcano plot indicates the magnitude and the significance of the identified expression differences. e Marker selection was performed in Morpheus (Broad Institute) to identify the top 20 transcription factors with decreased expression in the strongly responsive post-treatment samples for 03-311 trial and compared with the DESeq2 analysis for LCCC1214 from (a). The Venn diagram shows the 5 transcription factors common to both clinical data sets. f The post-treatment/pre-treatment log2 fold change of HER2, HER3, and PTK6 expression is shown for paired patient samples. g Paired post-treatment and pre-treatment samples from the LCCC1214 study were processed for kinome analysis by MIB/MS. The log2 MIB binding changes (post/pre) were plotted as the sum of strongly molecular responsive samples (patients 109, 116, 119, and 121) versus the average difference for weakly-responsive matched pairs and the top 25 differences in both directions are shown. h–j Log2 fold changes for the indicated matched patient samples as determined by MIB binding (x-axis) and RNAseq (y-axis).

