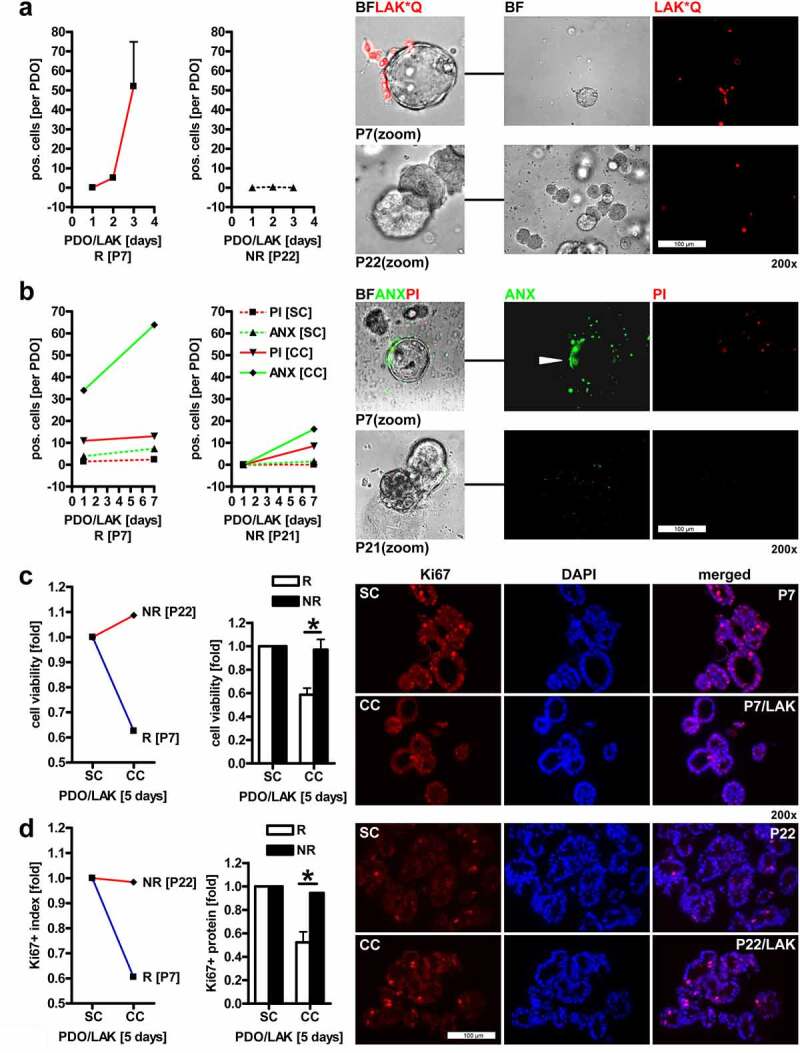
Figure 5.

LAK adhere to, invade and reduce growth and viability of CRC PDOs.A, Localisation of LAK in co-cultures with PDOs. IL2-stimulated allogenic LAK (from healthy donors) were labelled with Qtracker (red, abbrev. “*Q”) and co-embedded in MatriGel® with intact PDOs at an effector:target ratio of 100:1, followed by live cell imaging after 1 to 3 days. Quantitative analysis (left) and representative pictures (right). Data are mean numbers of LAK per PDO (as defined by an intact spheroid) ± S.E. (n=2 patients, n≥2 images per patient & day). NR = “non-responder” PDO (P22) with few adherent LAK; R = “responder” PDO (P7) with many adherent LAK. Color code: red = LAK*Q (labelled); BF (bright field) = PDO. Original magnifications 200x; B, Detection of cell death in co-cultures of LAK with PDOs. Organoids were co-cultured as in A, and viability was detected after 1 to 7 days by annexin (ANX) / propidium iodide (PI) staining and fluorescence imaging. Tumor cells and LAK suffered from cell death. Quantitative analysis (left) and representative pictures (right). Data are mean numbers of PI+/ANX+ signals per cell (LAK) or spheroid (PDO) ± S.E. (n=2 patients, n≥2 images per patient & day). NR = “non-responder” PDO (here P21, no signals were recorded for P22) with few dead cells; R = “responder” PDO (P7) with many dead cells in co-cultures. Color code: red = PI (necrosis); green = ANX (apoptosis); BF (bright field) = PDO+LAK. Original magnifications 200x; C, Co-culture of PDOs with LAK reduces overall cell viability. Organoids were co-cultivated as in A, followed by colorimetric MTT assay after 5 days. O.D. values were calculated as -fold ± S.E. PDO+LAK co-culture (CC) vs. PDO single culture (SC) (*p<0.05 R vs. NR, 2way-ANOVA with Bonferroni post-tests, n=6 patients, n=3 replicates per patient). Representative (left panel) and all (right panel) patients are presented. NR = “non-responder” PDO (P22) with many viable cells; R = “responder” PDO (P7) with few viable cells after co-culture with LAK; D, Co-culture of PDOs with LAK reduces CRC cell proliferation. Organoids were co-cultured as in A for 5 days. FFPE-sections were stained with Ki67 Ab for immunofluorescence microscopy. Quantitative analysis (left) and representative pictures (right). The ratio of Ki67+ nuclei vs. total nuclei was calculated as -fold ± S.E. (*p<0.05 R vs. NR, 2way-ANOVA with Bonferroni post-tests, n=6 patients, n=3 replicates per patient). Representative (left) and all (right) patients are presented. NR = “non-responder” PDO (P22) with many proliferating cells; R = “responder” PDO (P7) with few proliferating cells after co-culture with LAK. Color code: red = Ki67 (Ab), blue = DAPI (nuclei). Original magnifications 200x
