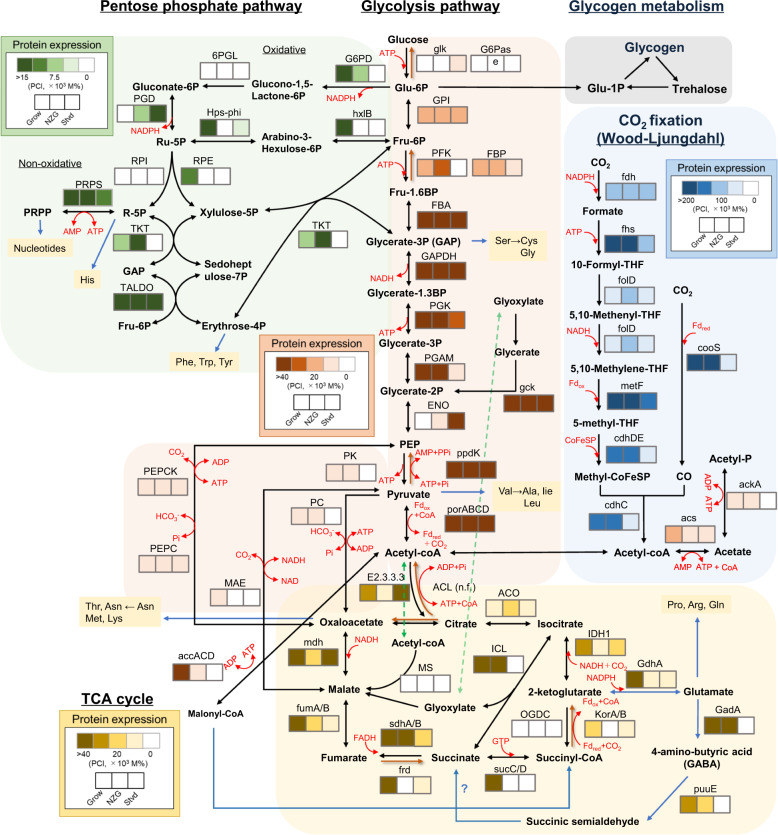
Fig. 6. Relative abundance of respective enzymes involved in central carbon metabolic pathways in “Ca. B. sinica” based on proteomeic analysis.
Protein expression level heatmaps of central carbon metabolic pathways (i.e., the Wood–Ljungdahl pathway, glycolysis pathway, and pentose phosphate pathway (reductive) tricarboxylic acid (TCA) cycle) in “Ca. B. sinica”, which was harvested in the growing, near-zero growth, and starved phase, respectively. The relative abundance of proteins represented as Protein Content Index (PCI, in mol%) values was portrayed by different colours in each pathway; the darker colour indicates the higher abundance and the lighter colour indicates the lower abundance. The names of enzymes, reactions, and corresponding PCI values are described in detail in the Supplementary information Tables S5–S8. n.d. not detected.

