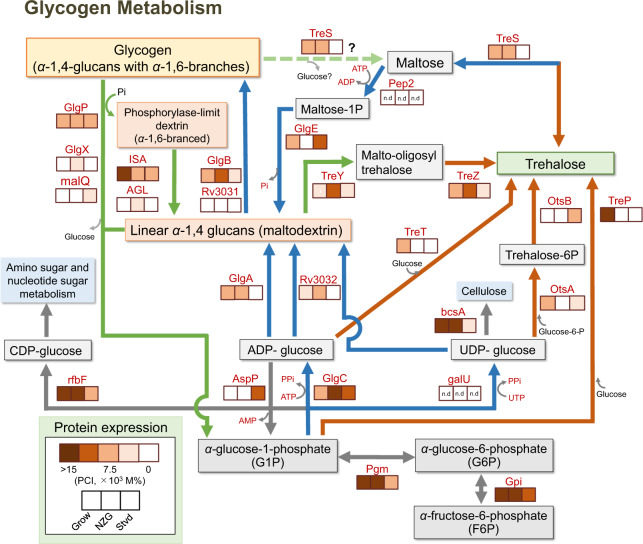
Fig. 7. Relative abundance of respective enzymes involved in glycogen metabolism in “Ca. B. sinica” based on proteomic analysis.
Protein expression level heatmaps of main glycogen and trehalose metabolic pathways in “Ca. B. sinica”, which was harvested in the growing, near-zero growth, and starved phase, respectively. The relative abundance of proteins represented as Protein Content Index (PCI, in mol%) values was portrayed by different colours; the darker colour indicates the higher abundance and the lighter colour indicates the lower abundance. The names of enzymes, reactions, and corresponding PCI values are described in detail in the Supplementary information Table S9. n.d: not detected. Blue arrows represent biosynthetic pathways of glycogen, green arrows represent degradation pathways of glycogen, and orange arrows represent biosynthetic pathways of trehalose, respectively.

