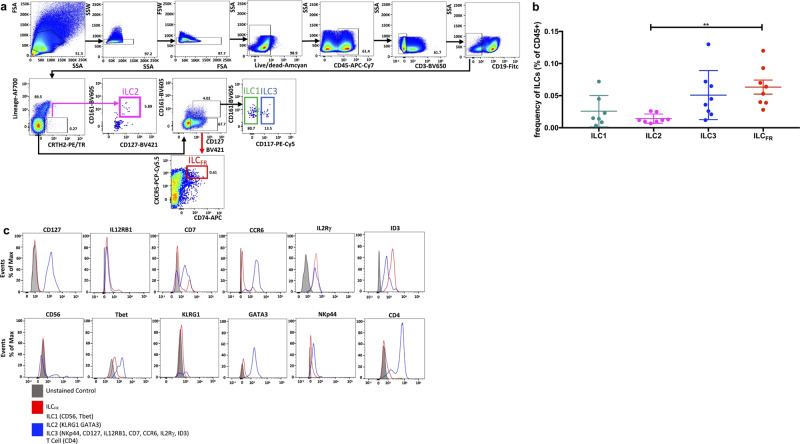
Fig. 1. A unique ILC population exists in human tonsils.
a Representative conventional flow cytometry plots from an adult tonsil showing the hierarchical phenotype gating strategy from singlet lymphocytes to the ILC1 (green), ILC2 (pink), and ILC3 (blue) and a unique ILC subset (ILCFR) (red) populations indicated by arrows and color-coded gates. (Lin = CD4, CD11b, CD11c, CD14, CD16). b Graph shows frequency of ILC1, ILC2, ILC3, and ILCFR among CD45+ human tonsil mononuclear cells (n = 7 or 8 biologically independent tonsils per group, 3 independent experiments) (Ordinary one-way ANOVA with multiple comparisons; F = 5.2; **p = 0.0058; Mean ± SD). c Analysis of surface and transcription markers on ILCFR by flow cytometry. Gray histograms depict fluorescence minus one (FMO) control of each antibody. Red lines indicate ILCFR. Blue lines denote ILC1 (for CD56, Tbet), ILC2 (KLRG1, GATA3), ILC3 (NKp44, ID3, CD127, ILR12RB1, CD7, CCR6, IL-2Rγ), and T cells (CD4) (n = 10 biologically independent tonsils per group, 3 independent experiments).

