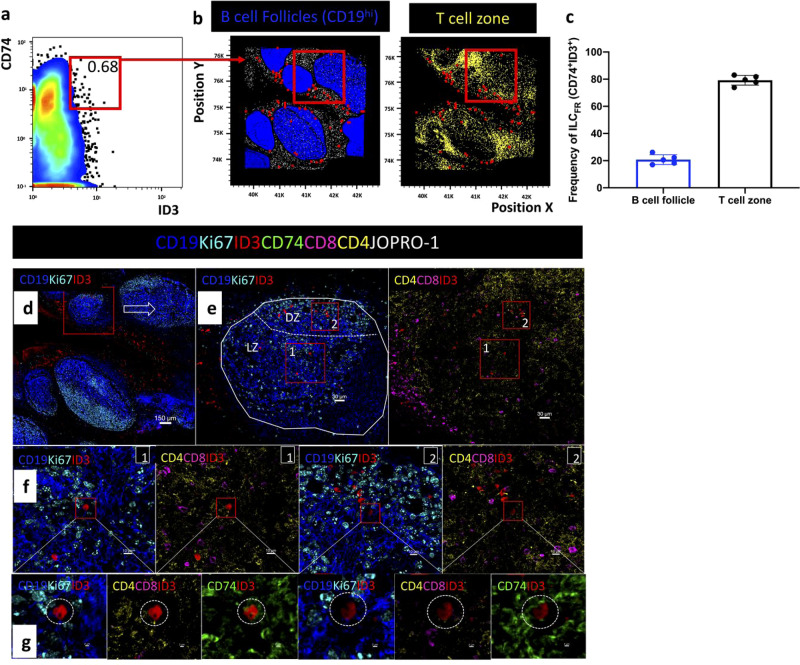
Fig. 3. Distribution of CD74+ ID3+ ILCFR in human tonsillar B cell follicles.
a Histocytometry analysis showing the frequency of CD19− CD8− CD4− CD74+ ID3+ ILCFR in a tonsillar tissue section (tonsil #1) and b Overlay showing the distribution of CD74+ ID3+ ILCFR (red dots) with respect to CD19+ B cells (dark blue dots) and CD4+ T cells (yellow dots) in the same tonsil. c Bar graph summarizing the frequencies of intra- and extra- follicular ILCFR (CD19− CD8− CD4−CD74+ ID3+) as a frequency of total ILCFR in five tonsils. d Confocal images showing the tonsil area imaged, distribution of B cell follicles as denoted by CD19 (dark blue) and Ki67 (cyan) as well as ID3 positive cells (red). e Close up of a B cell follicle. Dotted lines demarcate the area of the follicle (LZ) as well as the dark zone (DZ) as defined by the density of Ki67 staining (cyan). B cells are shown in blue (CD19+), proliferating cells in cyan (Ki67+), ID3 in red, CD4 in yellow and CD8 in magenta. f Zoomed in details of the red rectangular enclosures shown in (e). The location of a CD74+ (green) ID3+ (red) cell is shown with respect to the positioning of CD19+ (blue) Ki67 (cyan) cells or CD8+ (magenta) and CD4+ (yellow) lymphoid cells. g Zoomed in close-ups confirming the positioning and phenotype of ILCFR (CD19-CD4− CD8− CD74+ ID3+). Images were acquired at ×40 (NA 1.3) with no zoom. Images shown are sequential digital magnifications of 150 um (d), 30 um (e), 10 um (f), and 2 um (g). A total of five biologically independent human tonsils were imaged.

