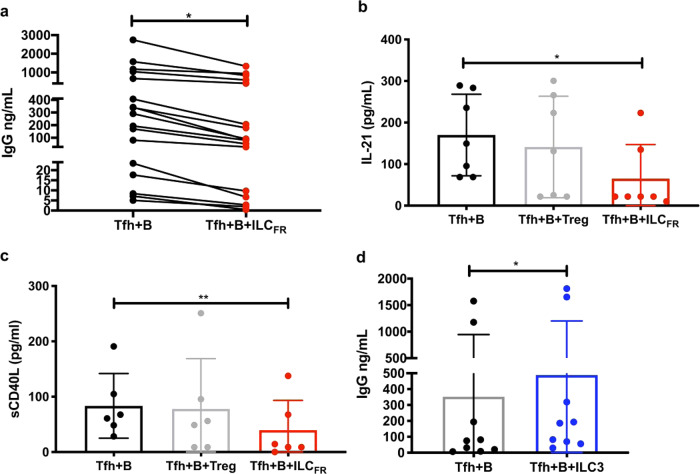
Fig. 4. ILCFR and ILC3s modify the GC-B and GC-Tfh interaction.
a Production of IgG in the supernatants of 5-day co-culture of 30,000 GC-Tfh with 30,000 autologous GC-B cells plus or minus addition of 1000 ILCFR in the presence of 100 ng/mL SEB superantigen measured by ELISA (n = 17 biologically independent tonsils per group, 5 independent experiments) (Paired, two-tailed parametric t-test; *p = 0.011; t = 2.899, df = 16, 95% CI (−432.2 to −67.08), Mean ± SD). b Production of IL-21 or c sCD40L analyzed by 28 plex Luminex. (n = 6–7 tonsils per group, 3 independent experiments) (Ordinary one-way ANOVA with multiple comparisons; IL-21: F = 3.542; *p < 0.0467; Mean ± SD), sCD40L: F = 6.081; **p < 0.0014; Mean ± SD). In d the graph shows IgG production in the supernatants of 5-day co-culture of 30,000 GC-Tfh with 30,000 autologous GC-B cells plus or minus addition of 3000 ILC3 in the presence of 100 ng/mL SEB superantigen measured by ELISA (n = 8 biologically independent tonsils per group, 4 independent experiments) (Paired, two-tailed parametric t-test; *p = 0.018; df = 7, t = 3.09, 95% CI: (9.47 to 71.15), Mean ± SD).

