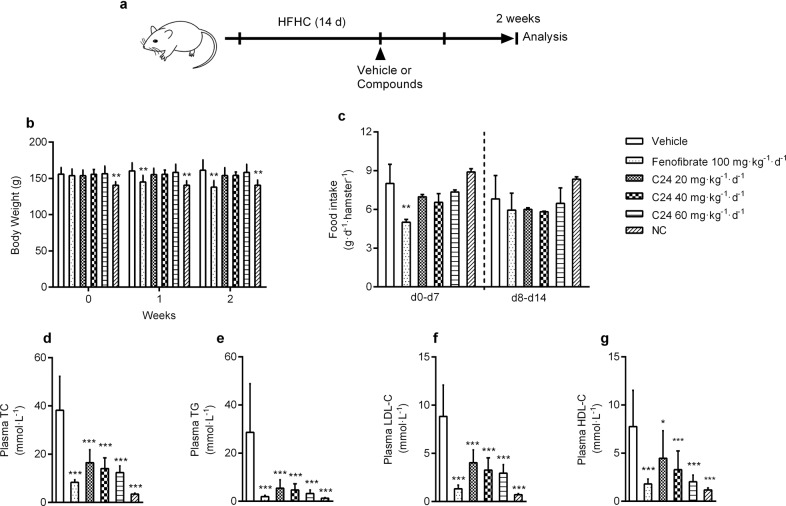
Fig. 5. C24 treatment improves dyslipidemia in HFHC-fed hamsters.
a Schematic diagram of the pharmacodynamic experiment in HFHC diet-fed hamsters. b, c The body weight and food intake during treatment in HFHC diet-fed hamsters. NC represents hamsters fed normal chow and treated with CMC-Na. d–g The concentrations of plasma TC (d), TG (e), LDL-C (f), and HDL-C (g) after treatment with or without C24 for 2 weeks. Data are presented as the means ± S.D., n = 8. Body weights and food intake were analyzed using two-way ANOVA, multiple groups were analyzed using one-way ANOVA, *P < 0.05 vs. Vehicle; **P < 0.01 vs. Vehicle; ***P < 0.001 vs. Vehicle.

