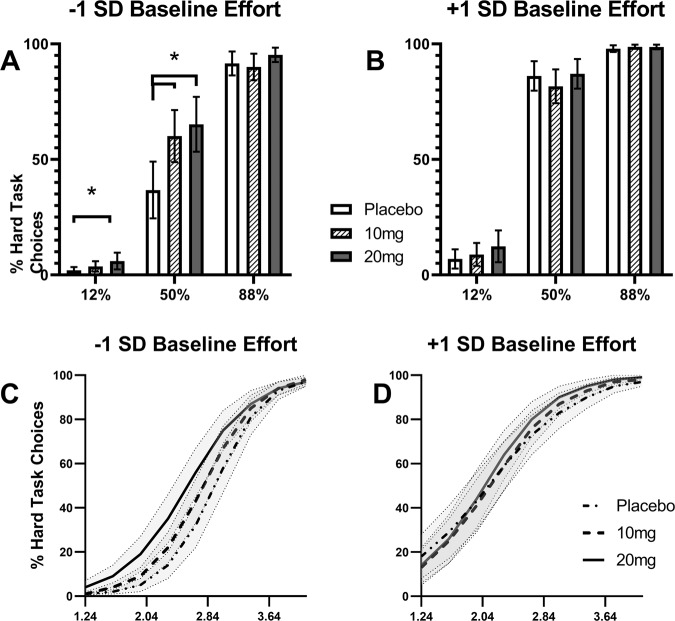
Fig. 3. Baseline effort moderator analyses on the EEfRT.
Graphs display one standard deviation below and above the mean baseline effort for visual purposes only. In the analysis, baseline effort was used as a continuous moderator. a % hard task choices by probability in low baseline effort. b % hard task choices by probability in high baseline effort. c % hard task choices by probability and amount in low baseline effort. d % hard choices by probability and amount in high baseline effort.

