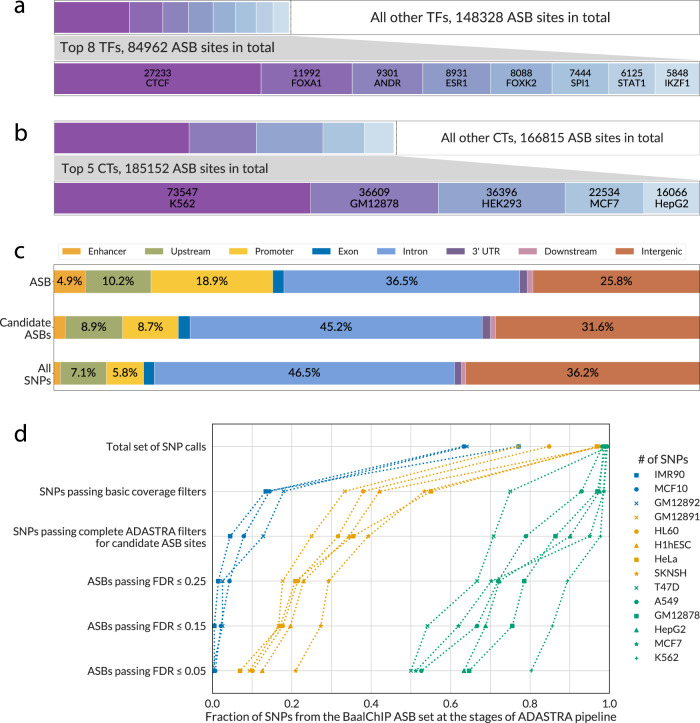
Fig. 3. An overview of the ADASTRA ASBs and their genomic localization.
a, b The distribution of ASBs across TFs and cell types is not uniform. The top 8 TFs and top 5 cell types provide only nearly one third (TFs) or one half (cell types) of significant events. The bottom bars in each pair show the zoomed-in data for the top 8 TFs and top 5 cell types sorted by descending number of ASBs. c The complete bars correspond to the full set of SNPs (unique dbSNP IDs) with significant ASBs. The ASBs are more often found in promoters and enhancers as compared to either SNVs with candidate ASBs or all detected SNVs. The percentage of ASB-carrying SNPs falling into particular types of genomic regions is shown on bar labels. Top bar: significant ASBs (passing 5% FDR, 269,934 sites in total); middle bar: SNPs with candidate ASBs (passing the coverage thresholds and tested for significance, 2,024,836 sites in total); bottom bar: all SNPs detected in the variant calling (4,976,303 sites in total). d The fraction of BaalChIP-reported SNPs (X-axis) with allele-specific binding passing the filters at various stages of the ADASTRA pipeline (Y-axis). We considered data from 14 cell lines matching between BaalChIP ASB set and ADASTRA (with the ADASTRA ASBs reaggregated considering only 316 data sets shared between BaalChIP and ADASTRA out of a total of 548 BaalChIP ChIP-Seq data sets). The following checkpoints of the ADASTRA pipeline were considered: 1 Total set of SNP calls: SNPs found by GATK; 2 SNPs passing basic coverage filter: SNPs with ≥5 reads supporting each of alternative alleles; 3 SNPs passing complete ADASTRA filters for candidate ASB sites: heterozygous dbSNP common SNPs with total coverage of at least 20 reads in at least one experiment located in a chromosome eligible for BAD estimation, i.e., with ≥100 SNP calls at stage 2; 4 ASBs passing a fixed FDR: cell type level aggregated ASBs passing a given FDR threshold (Benjamini–Hochberg-corrected P value allowing for BAD). ASB P values were estimated by logit aggregation of the one-tail Negative Binomial P values across the experiments (see “Methods”) and then the FDRs were estimated with Benjamini–Hochberg procedure. CT cell type, TF transcription factor, SNP single-nucleotide polymorphism, ASB allele-specific binding, FDR false discovery rate.

