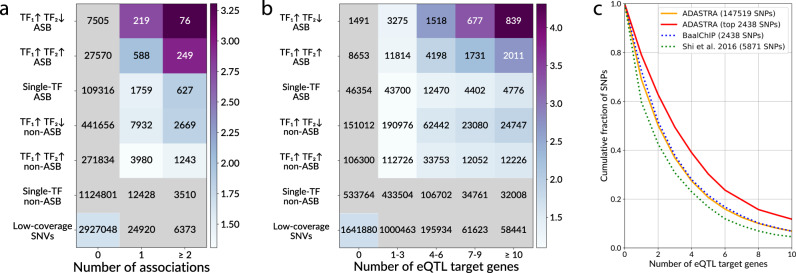
Fig. 5. ASBs are enriched with pathologic phenotype associations and eQTLs.
a, b Enrichment of ASBs among phenotype-associated and eQTL SNVs. Y-axis denotes several exclusive groups of SNPs: TF1↑TF2↓, SNVs carrying both Ref- and Alt-ASBs of different TFs, i.e., where at least two TFs prefer to bind alternating alleles; TF1↑TF2↑, SNVs carrying ASBs for at least two TFs preferring to bind the same allele; single TF, SNVs with ASB of a single TF; low-covered SNVs that did not pass a total coverage threshold ≥ 20. Non-ASBs are SNVs with the TF-ASB FDR > 0.05. X-axis: a the number of unique (dbSNP ID, trait, database) triples for a given SNV considering four databases of SNP-phenotype associations (EBI, ClinVar, PheWAS, and BROAD autoimmune diseases fine-mapping catalog); b the number of eQTL target genes according to GTEx eQTL data. The coloring denotes the odds ratios of the one-tailed Fisher’s exact test for the enrichment of SNVs with associations for each group of ASBs (against all other SNVs in the table). The gray cells correspond to nonsignificant enrichments with P > 0.05 after Bonferroni correction for the total number of cells. The values in the cells denote the numbers of SNVs. c The fraction of ASB SNPs from particular ASB collections (Y-axis) coinciding with GTEx eQTLs passing a certain threshold for the number of target genes (X-axis). Fourteen cell types overlapping between ADASTRA (solid orange line) and BaalChIP (dotted blue line) data have been considered: A549, GM12878, GM12891, GM12892, H1hESC, HL60, HeLa, HepG2, IMR90, K562, MCF10, MCF7, SKNSH, T47D. Data for HeLa and GM12878 cells were extracted from the Shi et al. collection (dotted green line). A subset of 2438 top-significant ADASTRA ASBs (the subset size equal to that of the BaalChIP set) is additionally shown to illustrate that these ASBs relatively more often coincide with potent eQTLs. SNP single-nucleotide polymorphism, SNV single-nucleotide variant, ASB allele-specific binding, eQTL expression quantitative trait loci.

