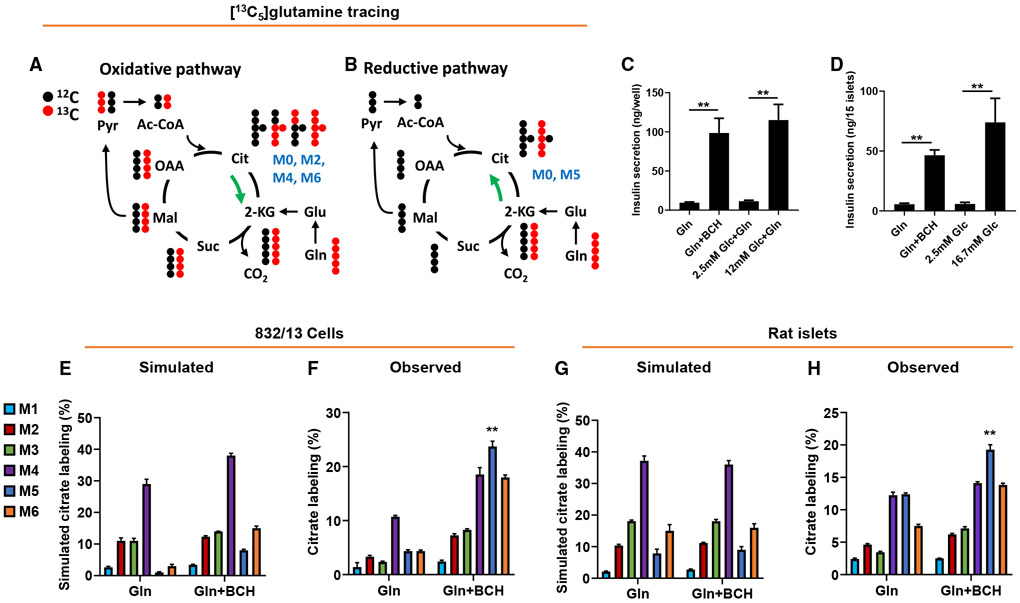
Figure 1. Metabolism of [13C5]Gln by the reductive (counter-clockwise) TCA cycle pathway in 832/13 cells and primary rat islets.
832/13 cells or primary rat islets were incubated for 2 h in secretion buffer in the presence of 5 mM [13C5]Gln ± BCH prior to insulin secretion and GC-MS analyses.
(A and B) Conceptual scheme of the metabolic fate of [13C5]Gln metabolized via oxidative TCA cycle (A; clockwise) or reductive TCA cycle (B; counter-clockwise) pathways. Only the first cycle is shown for clarity.
(C and D) Insulin secretion from 832/13 cells (C) and rat islets (D) in response to Gln + BCH or stimulatory glucose (12 mM for 832/13 cells, 16.7 mM for primary islets).
(E and G) Simulated citrate isotopologue labeling from [13C5]Gln in 832/13 cells (E) or rat islets (G), based on measured labeling of pyruvate and malate (Figure S1), and assuming oxidative (clockwise) metabolism only.
(F and H) Measured citrate isotopologue labeling in 832/13 cells (F) or rat islets (H), treated with 5 mM [13C5]Gln ± BCH.
Data represent three independent aliquots of 832/13 cells and two independent islet aliquots, assayed in triplicate (cells) or duplicate (islets). ** denotes that the M5 isotopologue of citrate (blue bar) is the only one that fulfills the dual criteria of being significantly increased in the observed versus simulated data comparison, as well as being significantly increased in the presence relative to the absence of BCH, in both 832/13 cells and rat islets, with p < 0.01 for both comparisons in each cellular setting.

