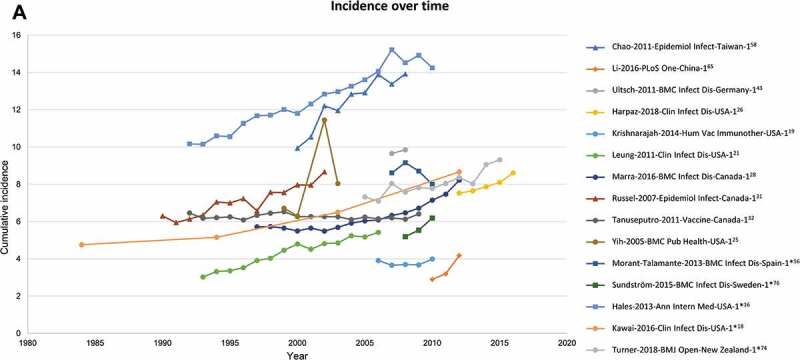
Figure 4.

Cumulative HZ incidence (number of new HZ cases per 1,000 population) by (A) Time, (B) Age (region).Source: Table 1Figure 2A: Studies with at least 2 years of data are depicted*Incidence rate (number of HZ cases per 1,000 person-years) converted to cumulative incidence (number of HZ cases per 1,000 population)HZ, herpes zosterNote: While 42 publications reported cumulative incidence, only 30 of these presented an overall incidence for those ≥50 years and are depicted here
