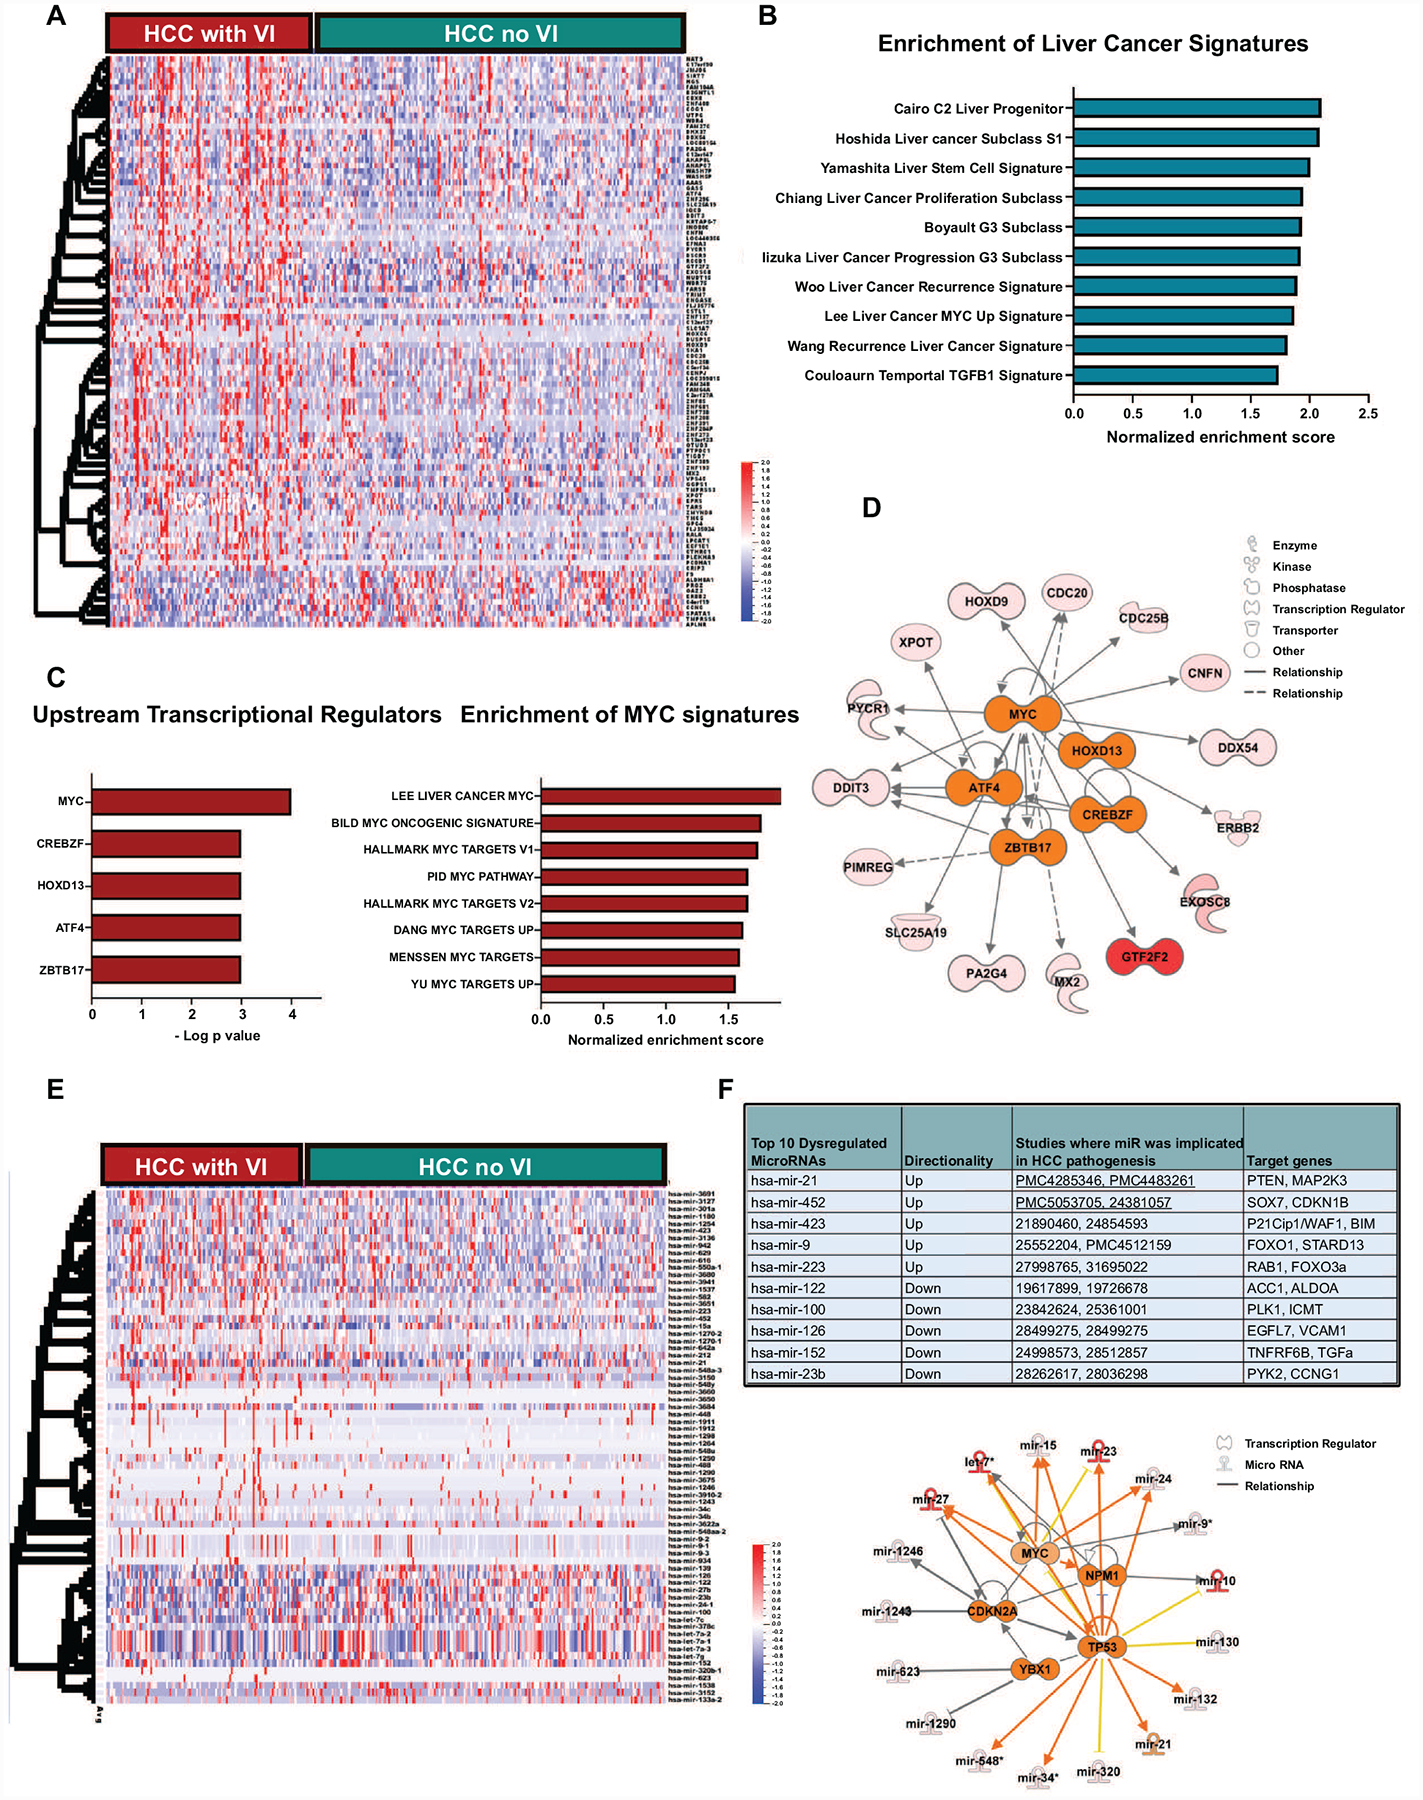
Figure 2. Transcriptional landscape of hepatocellular carcinoma with vascular invasion.

a. Heatmap shows the top differentially expressed genes between tumors with and without vascular invasion. b. Bar graph showing enrichment of major liver cancer signatures associated with poor prognosis in the tumors with vascular invasion. c. The top 5 upstream regulators of the transcriptional changes in tumors with vascular invasion.d. Bar graph showing enrichment of major MYC signatures associated in the tumors with vascular invasion. e. Network analysis displays the top transcriptional regulators and their associated network of genes. e. Heatmap shows the top differentially expressed microRNAs between tumors with and without vascular invasion. f. Top 10 microRNA differentially expressed between tumors with and without vascular invasion and analysis of their top transcriptional regulators and associated network of mRNAs.
