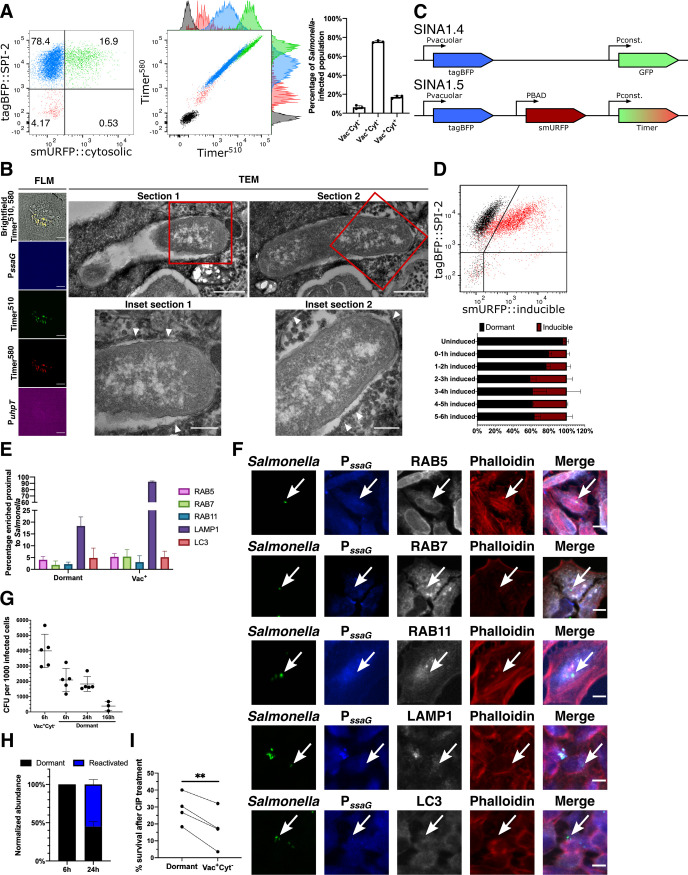
Fig 2. S. Typhimurium displays a novel inactive intracellular lifestyle in epithelial cells.
(A) (Left and Middle) Timerbac profile and distribution of single cells with no infection (black), infected cells with inactive bacteria (Vac-Cyt-) (red), infected cells with only vacuolar bacteria (Vac+Cyt-) (blue) and infected cells with both vacuolar and cytosolic populations (Vac+Cyt+) (green) at 6 h pi. (Right) Abundance of S. Typhimurium-infected cells (Vac-Cyt-, Vac+Cyt- and Vac+Cyt+) as illustrated in (A) (n = 3). (B) (Left) Brightfield and fluorescent microcopy (FLM) images of infected HeLa cells harboring Vac-Cyt- S. Typhimurium at 6 h pi. (Right) Serial sections of TEM images of Vac-Cyt- S. Typhimurium, arrowhead indicates host membrane structures of the SCV. (C) Schematic illustration for the constructions of SINA derivatives, SINA1.4 and SINA1.5. SINA1.4 was used for immunofluorescence staining against RAB5, RAB7, RAB11, LAMP1 and LC3; SINA1.5 was used for arabinose induction assay. (D) (Top) Responsiveness of intracellular S. Typhimurium towards an arabinose pulse between 5–6 h pi, uninduced control (black); arabinose-induced (red). (Bottom) Quantification on the responsiveness of Vac- S. Typhimurium pulsed at different time intervals during the infection time course, dormant (black), inducible (maroon). Samples were all harvested at 6 h pi. (n = 3) (E) HeLa cells were infected with SINA1.4-harboring S. Typhimurium, harvested at 6 h pi, fixed and stained. Quantification of the presence of RAB5, RAB7, BAB11, LAMP1 and LC3 proximal to Vac- and Vac+ S. Typhimurium at 6 h pi. (n = 3) (F) Representative images of Vac- S. Typhimurium (arrow) quantified in (D); S. Typhimurium (green), Vac- (blue), RAB5, RAB7, RAB11, LAMP1 and LC3 (grey), Phalloidin (red). (G) Designated populations of infected HeLa cells were enriched by cell sorting and plated for CFU. Quantification of CFU from dormant S. Typhimurium at 6 h, 24 h and 168 h pi and Vac+Cyt- S. Typhimurium at 6 h pi. (n = 5 for Vac+Cyt- 6 h, Dormant 6 h, 24 h; n = 3 for Dormant 168 h) (H) Quantification of SPI-2 activity using flow cytometry in enriched dormant S. Typhimurium at 6 h and enriched Vac-Cyt- infected cells re-plated until 24 h pi. (n = 3) (I) Survival percentage of dormant and Vac+Cyt- intracellular S. Typhimurium against 3 h of CIP treatment, infected cells were harvested at 6 h pi, enriched by cell sorting and plated for CFU. (n = 4) At least a total of 1000 events of infected cells were analyzed by flow cytometry or 50 infected cells by microscopy in each experiment replicates. The bars represent the mean, statistics were performed using unpaired t test (**p<0.01).

