
Fig 2. Non-linear least squares analysis and subsequent fitness landscape of HSV-1 IE, E and L genes show that IE and E genes are more vulnerable to A3 mutation than L genes.
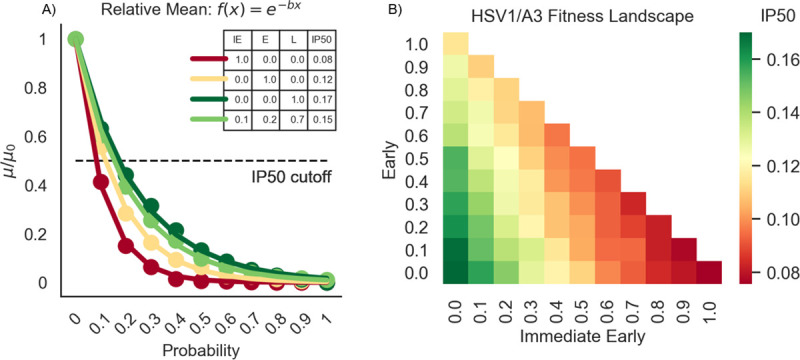
A) Relative mean, defined as the ratio of means (μ) from each increasing mutation probability versus the mean when the mutation probability is zero (μ0). For each baseline probability, these values are fit to an exponential curve f(x) = e-bx using non-linear least squares. The numbers for each stratification in the legend denotes the half-maximal inhibitory probability (IP50) for that stratum. The IP50 is analogous to the half-maximal inhibitory concentration–it measures how high of a mutation probability we need to reduce μ/μ0 by 50%, calculated by . Shown here are the strata: IE/E/L = .1/.2/.7 (light green), IE/E/L = 1/0/0 (dark red), IE/E/L = 0/1/0 (yellow), and IE/E/L = 0/0/1 (dark green). B) A heatmap of all strata. The gradient up the x-axis denotes a higher proportion of pressure on IE genes. The gradient up the y-axis denotes a higher proportion of pressure on E genes. Finally, the gradient down both the x-axis and y-axis denotes a higher proportion of pressure on L genes. The intensity of each color reflects the IP50 for that stratification–redder indicates a higher A3 pressure (low IP50), and greener indicates a lesser A3 pressure (high IP50). Note that the line colors in A) correspond to the heatmap intensities of those strata in B).