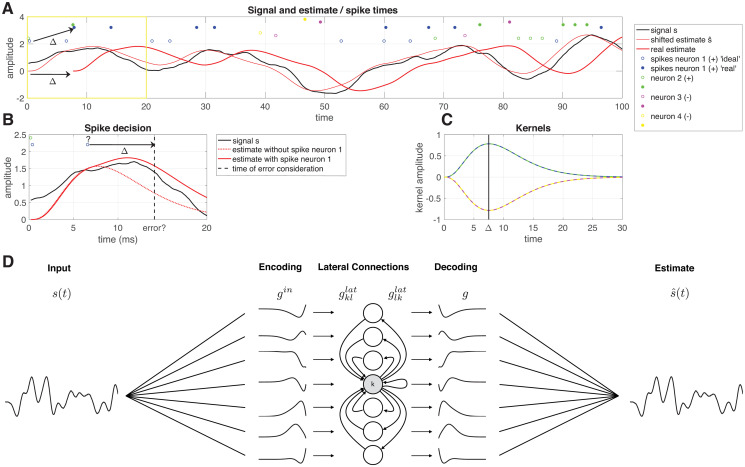
Fig 1. Overview of the network model.
A The signal (black), ideal estimate (thin red line), delayed estimate (thick red line), ideal spike trains ρideal (open dots) and real spike trains ρ (filled dots). B Zoom in of the yellow square in A. The decision whether the blue spike (denoted with a question mark) in ρideal will be fired, is made at time t + Δ. The spike is fired, because the estimate with the spike (solid red line) has a smaller error than the estimate without the spike (dashed red line). C Decoding filters g used in this network: neurons 1 and 2 (blue and green) have positive filters, neurons 3 and 4 (pink and yellow) have negative filters.D Each neuron k filters the input s(t) using an input filter . It receives input from other neurons l via lateral filters and sends input to other neurons l via lateral filters . Finally, the network activity can be decoded linearly using decoding filters gk.

