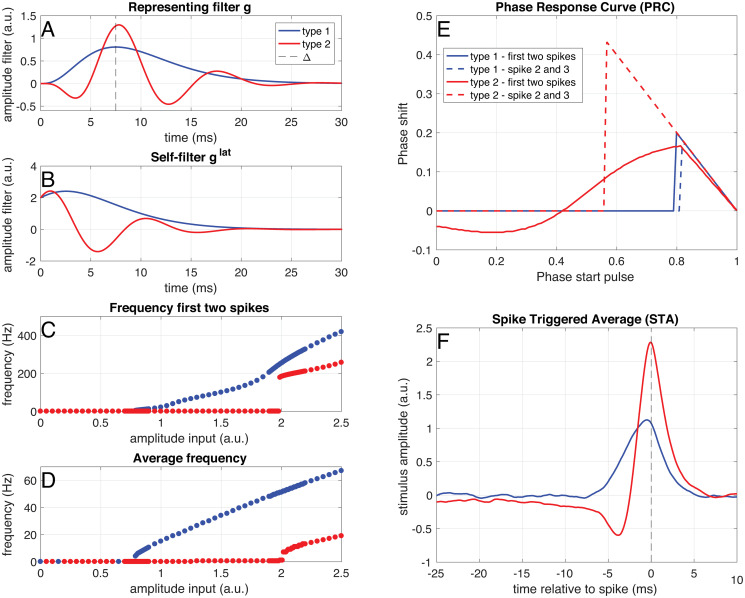
Fig 3. Example of a ‘type 1’ (blue) and a ‘type 2’ (red) neuron.
A Representing filter of a ‘type 1’ (blue) and a ‘type 2’ (red) neuron. B Self-filters for both neuron types. C Instantaneous frequency of the first two spikes in response to step-and-hold inputs of different amplitudes. D Average frequency in response to step-and-hold inputs of different amplitudes. E Phase-response curves for the first and second pairs of spikes, calculated as response to a small pulse (0.1 ms, amplitude 1.5 (‘type 2’) and 3.7 (‘type 2’)) on top of a constant input (amplitude 0.9 (‘type 1’) and 2.2 (‘type 2’)). F Spike-triggered average in response to a white-noise stimulus (amplitude: 0.45 (‘type 1’) and 1.1 (‘type 2’)) filtered with an exponential filter with a time constant of 1 ms.

