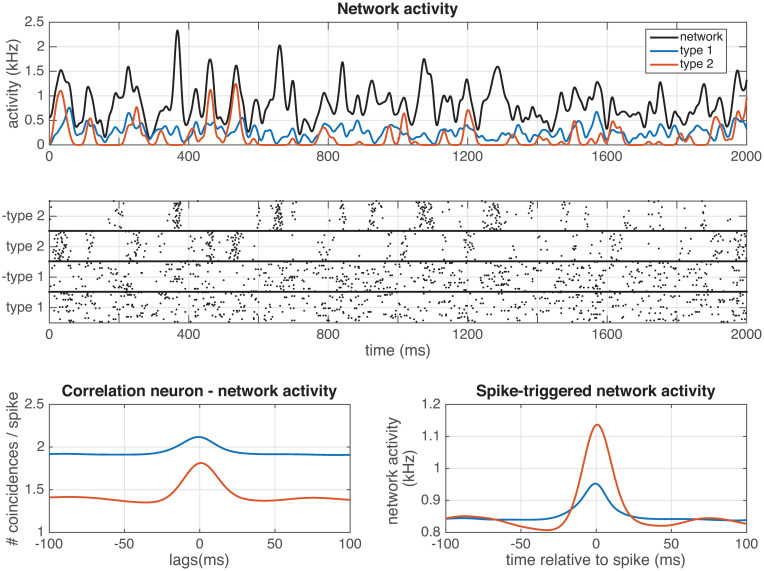
Fig 7. Network activity in a ‘type 1 & type 2’ network.
(see section Analysis and Fig 3). A) Average activity of the whole network (black), ‘type 1 on cells’ (blue line) and ‘type 2 on cells’ (red line). B) Spike response of the network. C) Average cross-correllogram between the network activity and ‘type 1, on’ cells (blue line) or ‘type 2, on’ cells (red line). D) Spike-triggered network activity for ‘type 1, on’ cells (blue line) or ‘type 2, on’ cells (red line). Next to the stimulus, each neuron in the network was presented with a noise input (of which half the power was independent, and half was shared with a subset of other neurons). Network: Δ = 7, 5 ms, ν = μ = 1, 5, N = 100. Stimulus: τ = 15 ms, amplitude = 2.7. Noise: τ = 15 ms, amplitude independent noise = 0.5, amplitude shared noise = 0.5. For the network activity, each spike was convolved with a Gaussian kernel (σ = 6 ms).

