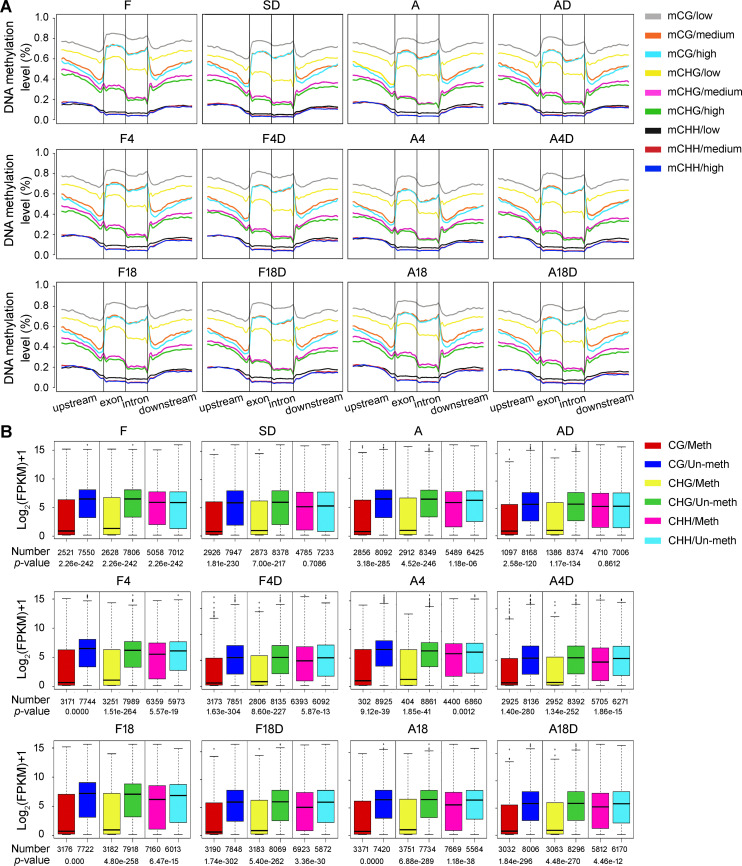
Fig 4. Effect of DNA methylation on gene expression in each sample.
(A) Relationship between the transcript abundance (low, medium, and high) of genes and the level of DNA methylation in the CG, CHG, and CHH contexts within the gene body (exon and intron) and flanking regions (2-kb sequences upstream and downstream of the protein-coding region, respectively). (B) Comparison of the transcript abundance between promoter-methylated and -unmethylated genes. Numbers of promoter-methylated and unmethylated genes, as well as the Wilcoxon rank-sum test p-value of each sample, are indicated below the diagram. Meth, promoter-methylated genes; Un-meth, promoter-unmethylated genes.

