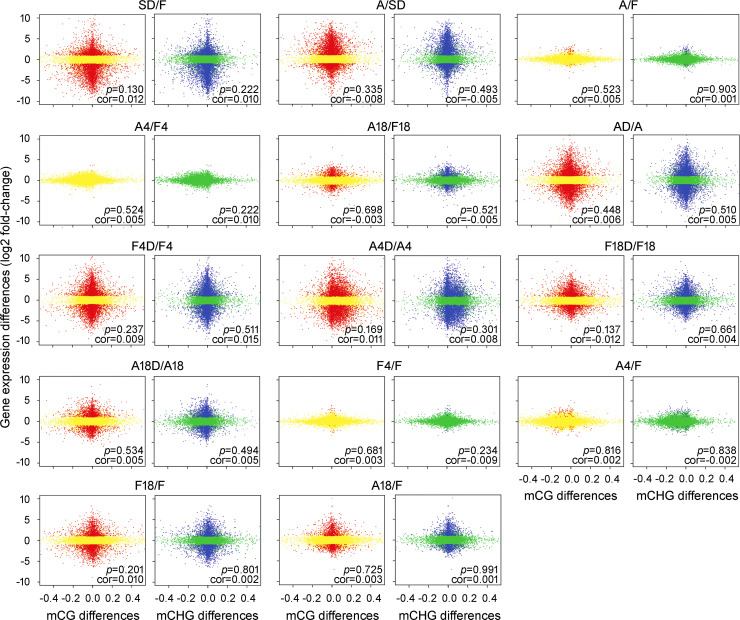
Fig 5. Correlation analysis of gene expression differences and promoter methylation variations in the CG and CHG contexts between samples.
DEGs and non-DEGs in the differential mCG plots are indicated by red and yellow dots, respectively. DEGs and non-DEGs in the differential mCHG plots are indicated by blue and green dots, respectively. Cor, Pearson correlation coefficient.

