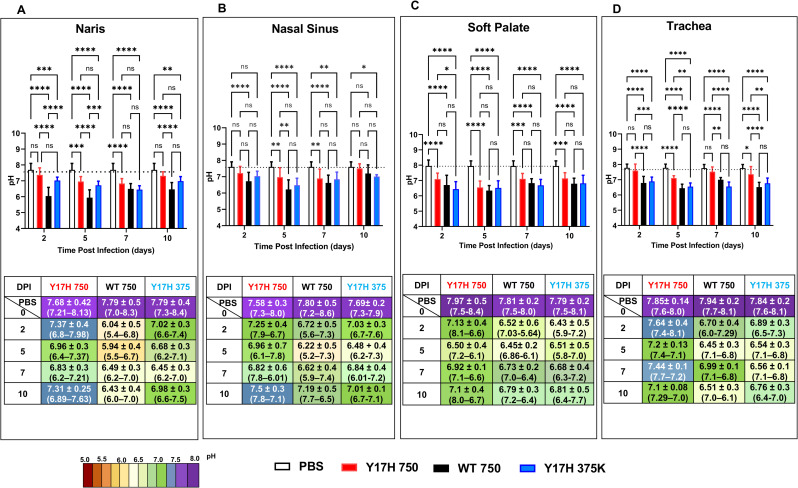
Fig 3. Extracellular respiratory tract pH in DBA/2 mice after infection.
Mice were intranasally inoculated with PBS, WT virus (750 PFU), or Y17H virus (750 or 375,000 PFU). (A-D) Naris pH (A), nasal cavity pH (B), soft palate pH (C), and tracheal pH (D). Reported values are the means ± SD (n = 10). The associated tables under the bar graphs contain the means ± SD (n = 10), and the ranges are indicated in parentheses. Values are the combined mean (±SD) from two independent experiments with 40 mice total. Mice were intranasally inoculated with PBS, 750 PFU of WT virus, 750 PFU of Y17H virus, or 375,000 PFU of Y17H virus. After 2, 5, 7, or 10 days of infection, extracellular pH values were measured in the nares, nasal cavity, soft palate, and trachea with an optical pH microsensor. Measurements were taken under isoflurane-induced anesthesia. The mice were then euthanized, and tissues were collected and processed for further analysis. Two way-ANOVA and Tukey posthoc tests were performed on each day. Significant statistical differences are indicated as follows: *, P < 0.05; **, P < 0.01; ***, P < 0.001; ****, P < 0.0001. Statistical significance tests compared the results to those for PBS-treated are shown in purple (*) or in connected lines and black (*) between groups. The bars for each group are colored as follows: PBS (white with black outline), WT (solid black), Y17H750-PFU (solid red), and Y17H 375-PFU (solid blue).

