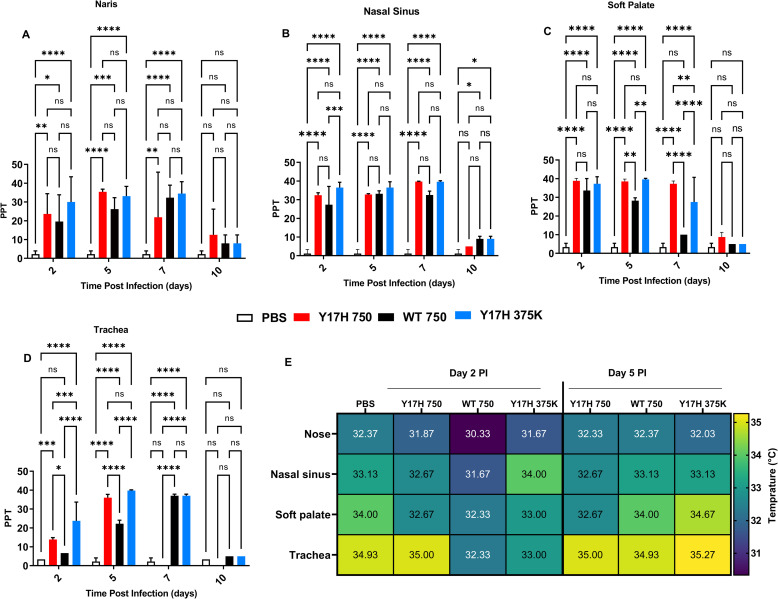
Fig 4. Extracellular respiratory tract salinity and temperature in DBA/2 mice after infection.
Mice were intranasally inoculated with PBS, WT virus (750 PFU), or Y17H virus (750 or 375,000 PFU). (A-D) Values from nares, nasal cavity, soft palate, and tracheal salinity expressed as parts per thousand (PPT). After 2, 5, 7, or 10 days of infection, extracellular salinity and temperature were recorded. Reported values are means ± SD (n = 10). Two way-ANOVA and Tukey posthoc tests were performed separately for each day, and significant statistical differences are indicated as follows: * P<0.5, ***P<0.01, ***P<0.001, and ****P<0.0001. (E) Summary of temperature values (degrees Celsius) for each group with a colored heat map (right).

