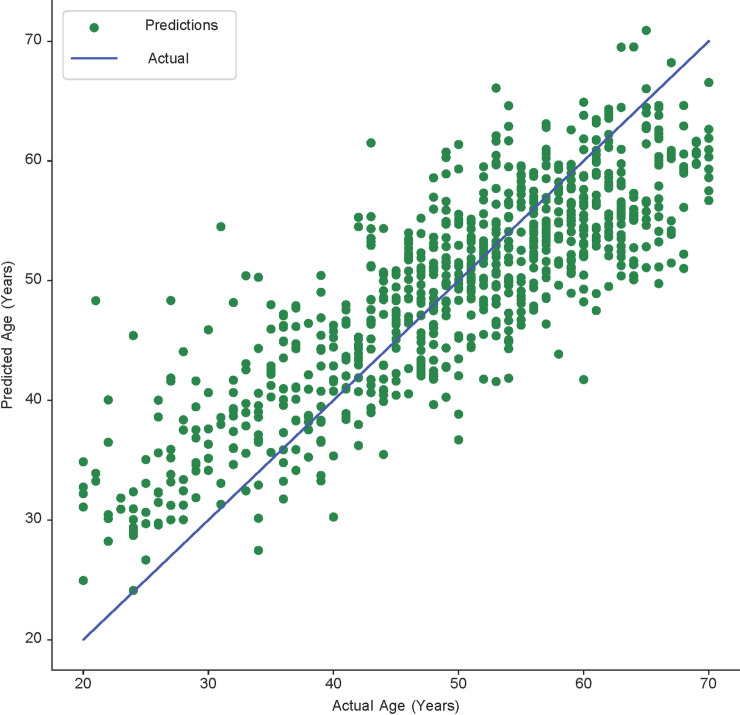
Fig 5. Scatter plot showing the final prediction results achieved by fusing the mandible and femur.
This plot shows the correlation between the predicted and actual ages. The points follow a linear pattern, implying that there exists a high linear correlation. The increasing amount of green dots close to the linear line indicates the improving accuracy of the age estimation.

