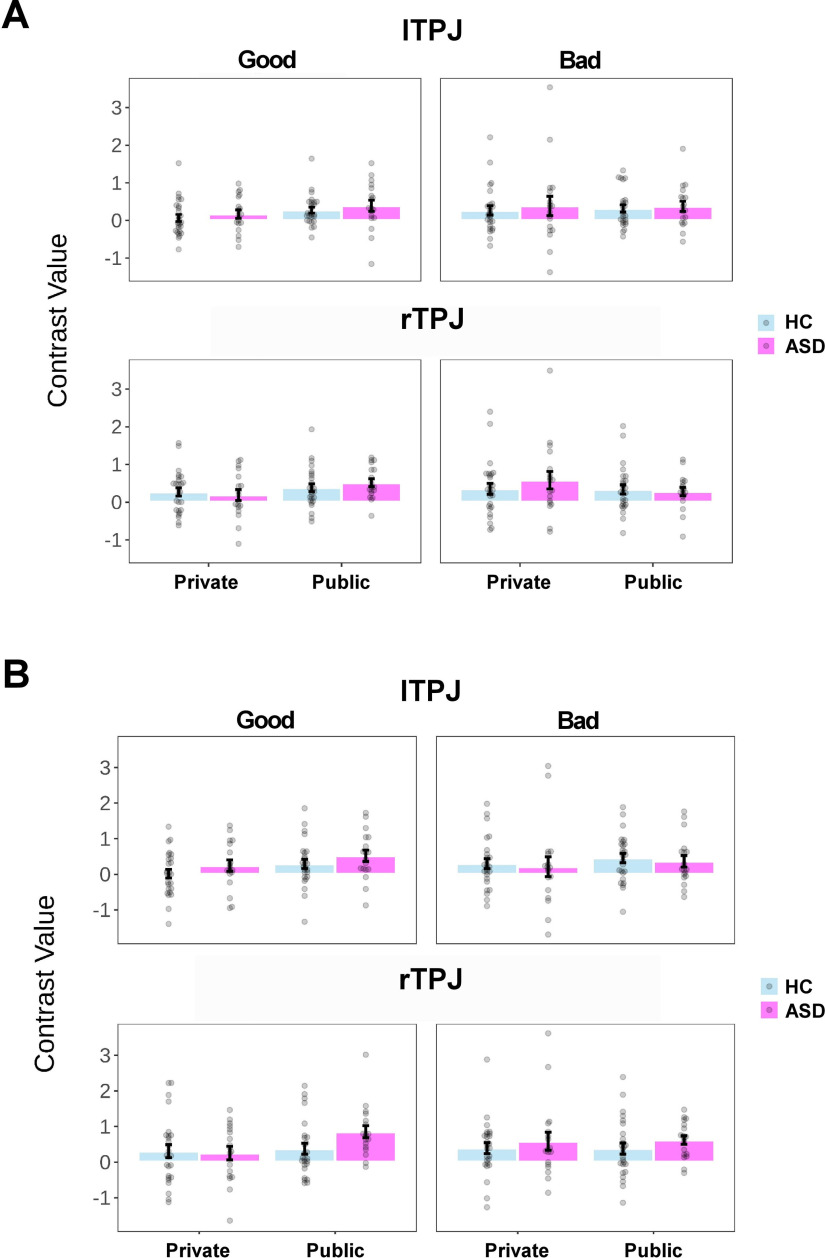
Figure 10.
A, B, Univariate results of TPJ in the HC and ASD groups using the parcellation-based mask (A) and the coordinate-based mask (B). For visualization, we extracted the mean activity (contrast value) of lTPJ and rTPJ from the corresponding masks as a function of group (ASD or HC), reputation (Private or Public), and context (Good or Bad). Each dot represents the data of a single participant. Error bars represent the SEM.

